

SBSQ #28b: Maye vs. Stafford and Yelp vs. Google
Plus, why the College Football Playoff selection process is intrinsically broken.

Hey subscribers, we’ve got a busy week ahead:
Later today, we’ll update QBERT and ELWAY with the results of the divisional playoffs.
Tuesday is the anniversary of Trump’s inauguration. I’ll have a Substack Live with Matt Yglesias of Slow Boring at 1 p.m. Tuesday, where we’ll discuss that and other things.
I’m also planning to revisit my 113 Trump predictions column from a year ago, probably landing late this week. Spoiler alert: I think the predictions are reasonably well-calibrated based on what we know so far. But I also think that doesn’t tell the whole story. (I have a lot of “meta” thoughts about how it’s going and whether the resistance libs were right about everything.)
Finally, our generic ballot polling average is ready to go. We just have to finish up a few elements on the charts and the presentation. This is basically the kickoff to our midterm election coverage, so we think it’s kind of a big deal! That’s also landing this week. It will also have some extra goodies attached, such as state-by-state benchmarks and historical generic ballot data.
Today, however, is a federal holiday1 and the college football national championship game, so we’re going to have some fun. I have a few leftover questions from this month’s SBSQ2 — two about football and one about food.
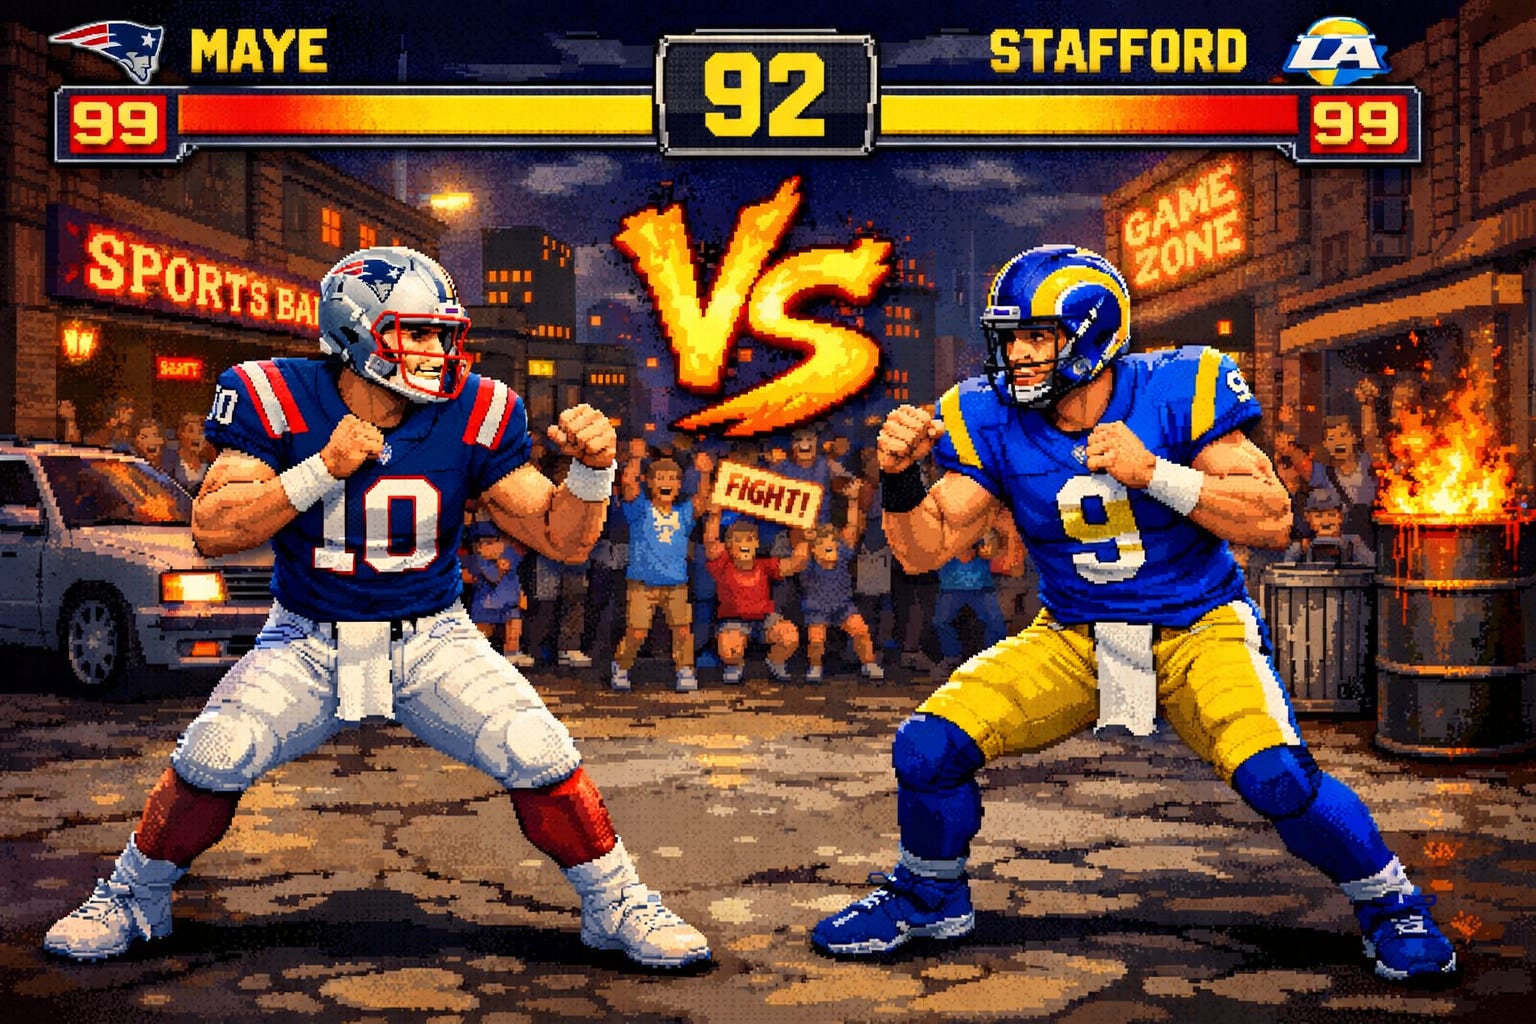
Why Drake Maye, not Matt Stafford, should be NFL MVP
Yelp vs. Google and Nate’s 3 tips for scouting restaurants
What’s wrong with the College Football Playoff selection committee?
SBSQs usually run behind the paywall, but we’ve been a little heavy on paid content lately, so we’re gonna run this one free. Asking questions is a benefit for paid subscribers, however! As always, we’d encourage you to submit questions for SBSQ #29 in the comments below.
Why Drake Maye, not Matt Stafford, should be NFL MVP
FlipperAndersonFan (not a real person3) asks:
Why are you and Bill Simmons stanning so hard for Maye? My boy Matty Stafford had more TDs, more yards. And the Rams faced a much tougher schedule. Approximately 85.4362 percent of Mays’s [sic] yards were against the Jets. Aren’t you supposed to be a stats guy? Stafford was a SUPER BOWL CHAMPION the same year that Maye was the second-string quarterback in the Duke’s Mayo Bowl.
The NFL’s MVP award is almost certainly going to come down to Maye and Stafford. Both of them led their teams to playoff wins yesterday but were far less than spectacular in doing so; the MVP is a regular season award anyway, however. Stafford is the fairly heavy betting favorite after having been named the first-team All-Pro QB.
This is a case where there’s a clash between traditional and advanced stats. Stafford’s “headline numbers” certainly look better — 4707 yards, 46 TDs versus Maye’s 4394 and 31. However:
Maye is almost a full win ahead of Stafford in QBERT (5.7 WAR versus 4.8), a clear enough lead that you wouldn’t say it’s within margin-of-error range.
Maye also leads in ESPN Total QBR expected points added; in fact, ESPN has Stafford third behind Dak Prescott.
EPA has Maye with an even bigger lead over the field, with Jordan Love in second.
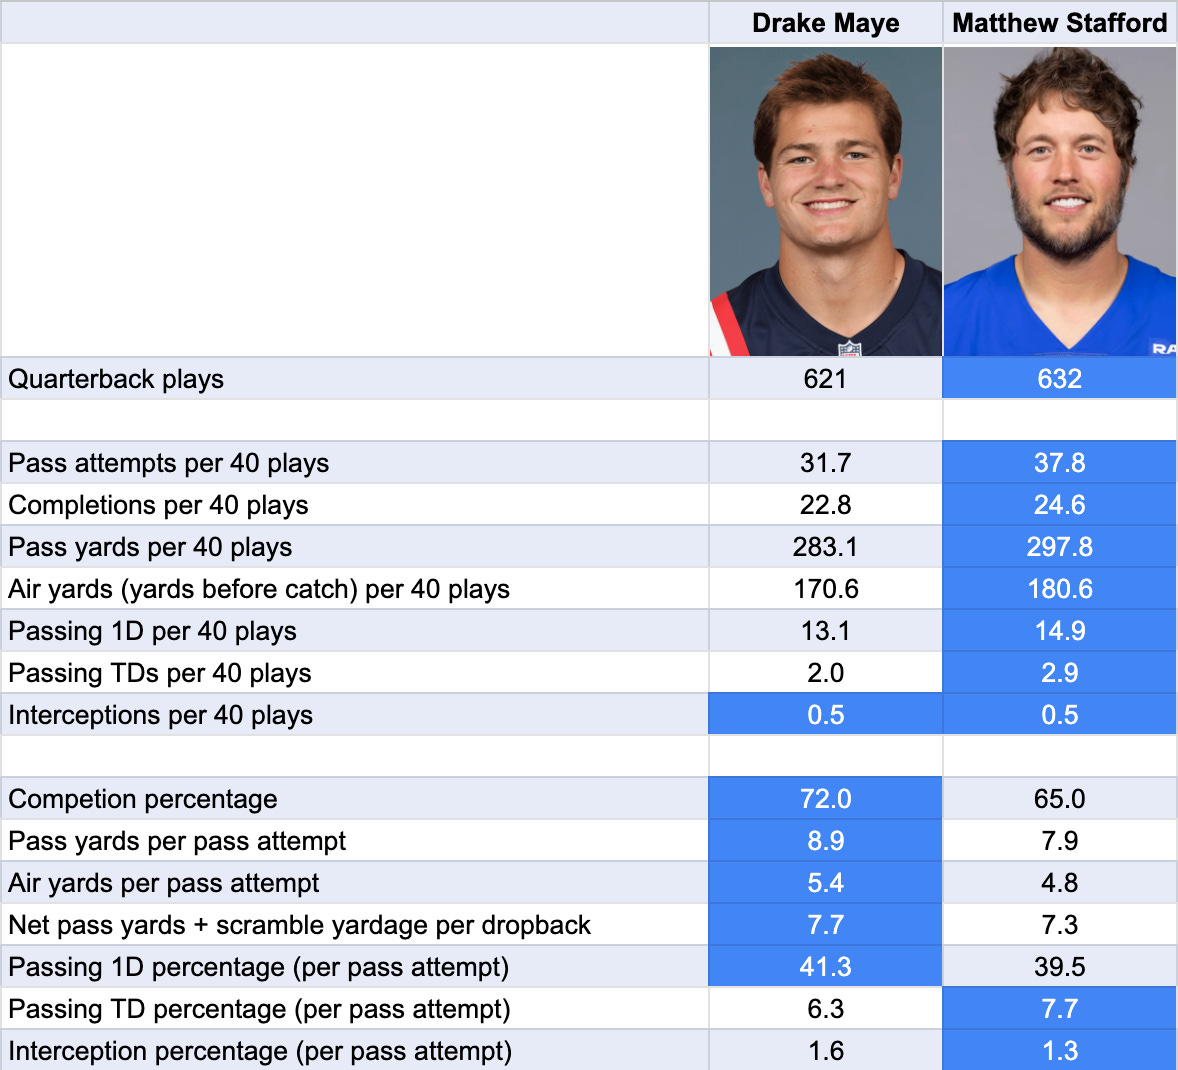
So let me explain from an advanced stats perspective why Maye comes out ahead. If you’re just looking at pure passing, it’s awfully close. Let’s bust out the tale-of-the-tape format that we’ve sometimes used in the past. (This is the first of two charts.)
OK, so here’s where I’ll need to get you into QBERT’s mindset. Traditionally, quarterback stats are framed in terms of pass attempts, e.g., completion percentage is completions divided by pass attempts. But what about sacks? They’re plays where the QB starts out with the intention of passing. And they’re actually worse than incompletions, since by definition sacks lose yardage4. It seems like a big mistake to just ignore sacks.
Except, if you’re going to account for sacks, what about scramble attempts that result in positive yardage? The difference between a 0-yard sack5 and a run for 1 yard on the same play is inherently ambiguous, but only the former is counted as a sack. And heck, at that point, you might as well account for designed QB running plays, too. These are relatively rare outside of sneaks, but even sneaking ability varies a lot from QB to QB.
Hence, QBERT evaluates quarterbacks by “QB plays”. These are any pass, any sack or any QB rushing attempt (except kneels, which we ignore). Basically, anything except handoffs. A typical quarterback today runs about 40 QB plays per game.
On a per-QB-play basis, Stafford has better passing numbers across the board. But that’s mostly because he has a much higher rate of pass attempts. Stafford doesn’t get sacked much and he basically never runs. So nearly every Stafford dropback results in a pass attempt.
However, if you do look at things on a per-attempt basis, the advantage shifts to Maye. He had a considerably higher completion percentage — even Tom Brady never approached 72 percent for a full season — while also averaging considerably more yards per attempt.6
Here’s a little stat I invented that makes for an interesting tiebreaker: net yards per dropback. The denominator is dropbacks — basically, any QB play except for designed runs. The numerator is passing yards plus rushing yards from scrambles minus yards lost on sacks. Maye is modestly better there, with 7.7 yards per dropback to 7.3 for Stafford.
But Stafford had both a higher TD rate and a lower interception rate, and those are obviously meaningful categories too. If you had a best passer award, I’d probably give it to Stafford.
However, Stafford just doesn’t run — at all.
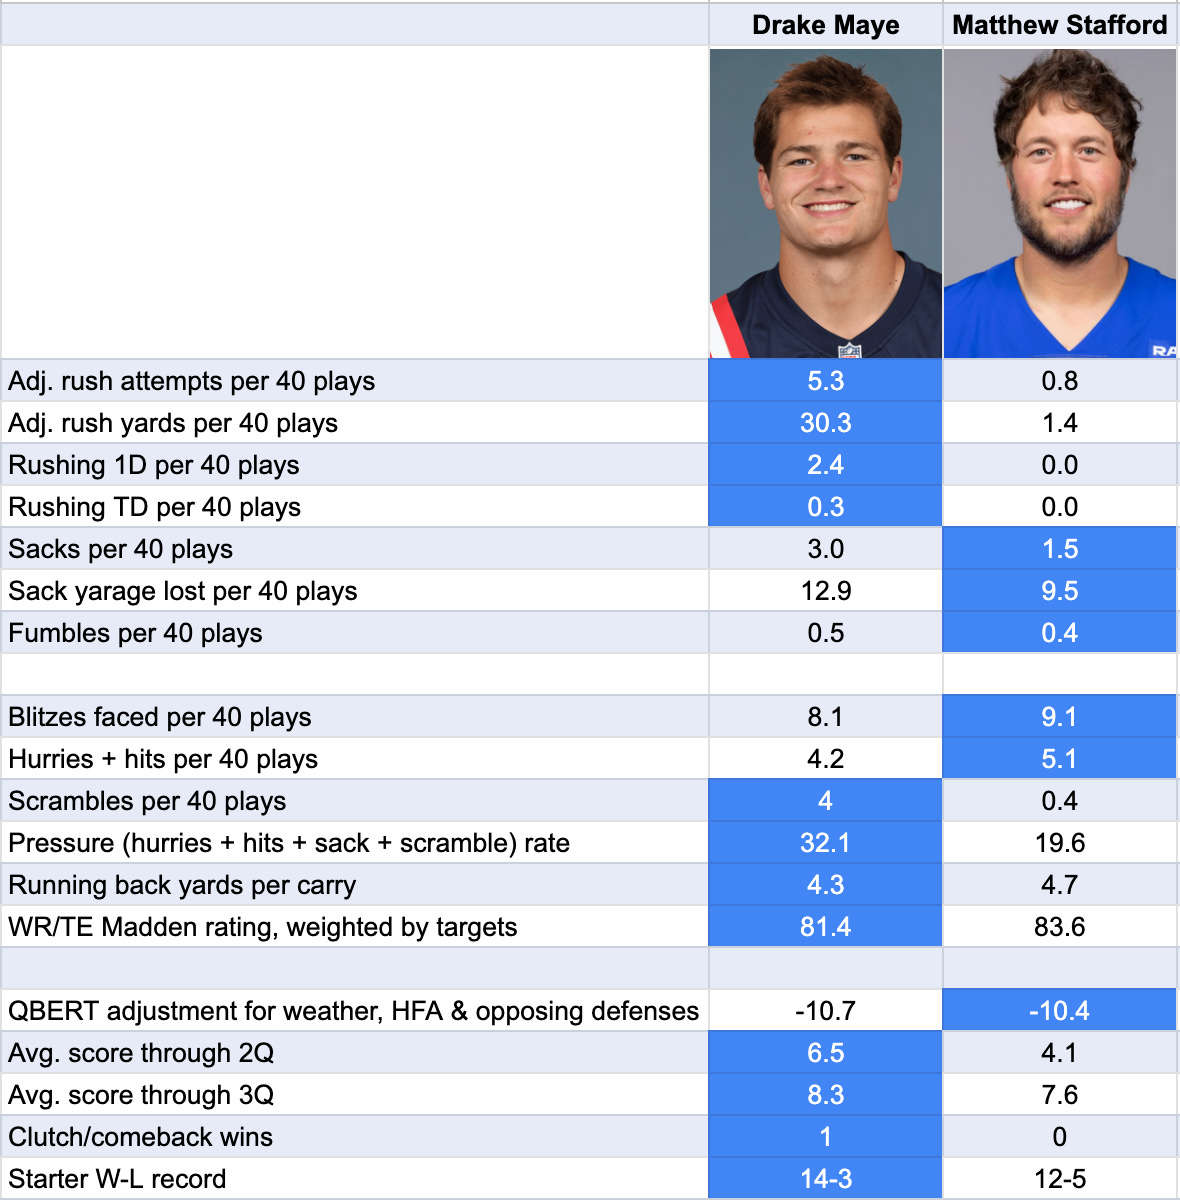
Stafford netted … one (1) rushing yard on the entire season. He didn’t have a single rushing first down this year. He’s had one (1) rushing TD in his last nine NFL seasons. If you watched that Rams-Bears game last night, you could see how this really limited the Rams’ strategic options in some situations. Whereas Maye is a good scrambler — in fact, he led the league in scramble attempts — who had 4 rushing touchdowns and 38 runs for first downs. And while Maye was sacked twice as often, he managed to scramble out of trouble enough to only lose 4.3 yards per sack to Stafford’s 6.5. The effects of sacks are pretty linear with yardage.
Basically, we’ve Done the Math … and Maye comes out ahead. Pitching a shutout in the rushing categories is enough to outweigh Stafford’s slight edge in pure passing. The other nerds who have done the same math come to the same conclusion; in fact, some of them see a bigger gap between Maye and Stafford than QBERT does.
QBERT also attempts to account for various factors related to team performance and game context — but Stafford would need a clear edge in these categories to overtake Maye. Instead, they probably add more on balance to Maye’s case. Stafford probably had the better O-line. There are different ways to measure pass pressure; Stafford was blitzed more often, although that may be in part because his lack of mobility makes blitzing less risky. Maye was hurried, hit, sacked or forced to scramble on 32.1 percent of his dropbacks, however, as compared to 19.6 percent for Stafford.
Meanwhile, the Rams’ running backs rushed for 4.7 yards per carry versus 4.3 for the Patriots. Stafford also had Puka Nacua and Davante Adams to throw to — and overall, the more skilled receiving targets.7
And the Patriots had a better record and were much more dominant, leading by almost a touchdown (6.5) in their average game at halftime. (QBERT makes an adjustment for this because teams adopt more risk-averse approaches when they have big leads, which can reduce a QB’s efficiency.) And although Stafford faced a considerably tougher schedule, Maye played outdoors in cold weather. So both guys had a similar gap between their raw and adjusted QBERT ratings.
It wouldn’t be some unspeakable tragedy if Stafford won. Maye is young enough and good enough that he’s probably going to contend for MVP awards many times, though he’ll need to be better than he was against the Texans yesterday. But it’s time to give due credit to QBs for their rushing/scrambling ability and that’s what this comes down to.
Yelp vs. Google and Nate’s 3 tips for scouting restaurants
Question for SBSQ #28
As a NYer we have a ton of dining options. So much so that I find myself browsing through Google reviews and Yelp ratings to winnow down choices. And many a times I notice a discrepancy of near a full 1.0 point, a not insignificant difference between “must try” and “must avoid”. This surprises me as these NYC restaurants usually have reviews in the hundreds if not thousands, and so I would think sample sizing would bring the scores closer.
Can you explain the discrepancy between Google reviews and Yelp and which is the more reliable assessment of a restaurant’s quality?
This is literally an ongoing argument with my partner. I tend to trust Yelp more, whereas he’s more of a Google guy. (We both agree that TripAdvisor isn’t very reliable for restaurants and strongly selects for tourist traps.)
Of course, the best answer is usually “neither of the above”. In general, any sort of human touch is helpful: friends’ recommendations9, critics’ lists like the Eater 3810, or a hotel concierge if you’re staying in nice digs.
Google does tend to have considerably higher star ratings than Yelp on average. I asked a source at Google about that — actually, I asked Google Gemini. It said this reflects a combination of a) Google explicitly encouraging businesses to solicit reviews, which often means 5-star ratings; b) Yelp being stricter about spam detection; c) Yelp having “higher friction” to publish something, since they require both a rating and a review, while Google can just be a star rating you dash off in a few seconds and d) Yelp attracting a “more specific ‘foodie-centric’ demographic”, which in practice tends to mean relatively well-off (stereotypically white or Asian American) urban Millennials and Gen Xers.
That’s a pretty candid answer by Gemini, and it makes me think I’m right about Google reviews generally being inferior to Yelp. On the other hand, there’s a certain type of restaurant that’s going to be rated highly by Yelp. Often these are places in sort of an “cute” upper middlebrow sweet spot and overweight customer experience relative to the quality of the food. Yelpers tend not to like anything too corporate-y, but the service and amenities at true “holes-in-the-wall” may not meet their standards or even hit their radar. Ratings can also be pulled down if the restaurant relies heavily on delivery (far easier to have a bad experience).
Within a couple of years, I’d expect most of this to be taken over by AI models anyway. Restaurant recommendations are, in my view, almost tailor-made for this purpose, in that there’s a lot of “fuzzy” context-dependent information that LLMs tend to excel at cataloging. Here, for example, is a modified version of a query I made to ChatGPT while visiting Helsinki last year.
We’d really like something with some heat, not just catering to bland Finnish/Euro taste, maybe Thai but doesn’t have to be. We’re currently at the Helsinki Art Museum, but we could also eat something back near our hotel in [other neighborhood]. Doesn’t need to be fancy, but we would like to be able to sit down and order a tea or a beer. Double check that it’s open at 2pm on a Tuesday. Give me a few good options.
Even if the responses aren’t perfect, you’ll usually get something that at least satisfies these complicated parameters — with less work than it takes to sort through restaurants one by one.
But to give you something more actionable until the robot takeover, here are a few tips I find fairly reliable:
Pay more attention to the number of reviews than the rating. Perhaps with some adjustment for how long the restaurant has been in business. I just want to know what’s popular, ideally with locals to the extent that’s possible to discern. There’s a phenomenon wherein as a restaurant, or anything really, becomes more popular, it will attract more haters because it appeals to a broader clientele, and people will feel more comfortable ragging on it. But popularity is a highly positive signal.
As obvious as this might seem, check out the menu. Every chef has a different palate, and I want food that appeals to mine. True, you don’t have to order from the whole menu — but if the chef’s sensibility isn’t a good fit11, I basically don’t trust that I’m going to like any dish on the menu. There are neighborhood joints where there are one to three standout dishes and the rest of the menu is mediocre, but these take a lot more work to find.
When picking restaurants, the perfect can be the enemy of the good. Especially in the largest cities. The vastness of restaurant options available somewhere like New York, Paris, or Tokyo is literally overwhelming. I live in New York, I dine out more than 95 percent of people, I put some effort into scouting restaurants, and still don’t feel like I’m “on top” of the scene. I’m not even sure how professional food critics keep up. Instead, consider which categories are likely to be comparatively strong in each city — Italian in NYC, fish tacos in San Diego — and how this correlates with different neighborhoods. If there are some restaurants that you consider absolute musts, book them well in advance. But honestly, I find that much anticipation can sometimes lead to disappointment. You probably want to have a couple of things nailed down, especially at prime hours on Fridays/Saturdays. But spontaneous experiences can often be highly enjoyable so long as you avoid outright tourist traps. This advice does not necessarily apply so much if you’re in a medium-sized restaurant market, like, say, Las Vegas, where there’s a more finite list of options.
What’s wrong with the College Football Playoff selection committee?
Not sure how much attention you pay to college football … but was wondering about your perspective on the final CFP rankings, and the apparent methodology behind it, from an analytics/“good use of data” perspective. The final rankings appear to reflect so many *bad* uses of data that they seem better off going back to a BCS-style algorithm (if getting the best/most deserving at-large teams is a goal). They appear to have no idea what to do with the results of conference championship games, apart from those games in conferences played between two teams who could otherwise not get at-large bids (they seem to have not considered the data point of Alabama getting blown out by Georgia), and seem to have double-counted Notre Dame’s loss to Miami (the loss had been reflected in the rankings of the respective teams for weeks, with Notre Dame consistently in front of Miami). Even if the CFP is going to use a methodology for selecting teams that isn’t the best use of data, shouldn’t they at least use the same methodology with each ranking, rather than changing the methodology in the final week?
As it happens, I’ve spent a fair amount of time on this question. The college football playoff model I built at FiveThirtyEight — we’d love to revive that at Silver Bulletin at some point, though I’m not sure it’s at the top of the priority list — literally tried to anticipate how the human voters would behave. And it was frustrating because there obviously wasn’t a lot of consistency. Sometimes head-to-head matchups or conference championships were given a lot of emphasis and sometimes they weren’t. Notre Dame (which should quit being such a diva and join the Big Ten) was also a constant source of frustration.
To be fair, in a 12-to-13 game regular season, there basically isn’t enough information to make fine distinctions between the teams. (The 17-game NFL season isn’t much better.)
But the fatal flaw with the CFP rankings is that the committee doesn’t actually know what it wants. Does it want the best teams, or the most deserving teams?
You might assume the latter: you want those teams that have earned their way into the playoff.
But the committee’s guidelines explicitly recommend considering “other relevant factors such as unavailability of key players and coaches that may have affected a team’s performance during the season or will likely affect its postseason performance”. This implies a predictive orientation. It’s true that if you’re building a model, you’ll want to account for things like injuries, especially if the injured players are now healthy again. But there are a lot of ways to get unlucky in football, and the committee doesn’t seem to want to adjust for — like, say, a game lost because of bad officiating, or a fluky interception that deflected into the cornerback’s fingertips. It generally doesn’t select teams with 3 or 4 close losses, even if they’d be favored on a neutral field by Vegas or a computer model.
Should they use an algorithm instead? I’ve always thought something like ESPN’s strength of record is a neat approach. I’ve also designed enough algorithms to know that it can be easy to overstate their precision; different “reasonable” modeling approaches can get you different answers. So I’m not sure I inherently hate the idea of humans getting involved in the close calls.
I’d just like to see the committee be clearer that it’s evaluating deservedness, not predicting what teams would be best in a game tomorrow. And I’d like to see it be more diverse than mostly just older athletic director/long-tenured ex-coach ex-jock types. Get some journalists who are watching tons of games every week and even some stat nerds in there. Failing that, maybe just default to the AP poll instead. In the meantime, Go Hoosiers.
Happy Martin Luther King Day!
For earlier installments, see also SBSQ#28a about Tim Walz and Venezuela, and an unofficial SBSQ about Zohran Mamdani.
For those new to Silver Bulletin, I’ll occasionally plant a question in SBSQ if it seems like something somebody would ask and I have thoughts about it that don’t quite reach the threshold for a standalone article. I’m probably doing this a bit too much and maybe something like the Maye vs. Stafford post could just have run on its own.
Sacks also produce a disproportionate rate of fumbles.
0-yard sacks are a thing because no-gain plays where the QB was intending to pass are recorded as sacks.
Technically, QBERT only gives credit for “air yards”, a.k.a. completed pass yards before the catch, but that doesn’t matter here as both Maye (60 percent) and Stafford (61) achieved a healthy fraction of their overall passing yards in the air.
In the chart, I’ve listed the Madden ratings for each QB’s receiving core. That’s not something that factors into QBERT’s calculations, though maybe it should!
“Human “ is the subscriber’s Substack handle!
There are exceptions. But someone who knows the local scene and even sort of cares about food is a heavy favorite to make better picks than you can on your own. Think about the situation in reverse. Sometimes I’ll have a friend come into town with highly particular ideas about where they want to eat, and it’s just like trust me, I have way more reps on restaurants in my own hometown than you do.
These are much more reliable in the U.S. than in foreign countries, though.
For me, this can be something like there being one too many ingredients in a dish, or too many sweet flavors as opposed to acid/salt/heat.
This question was edited for length.
FYI until last year I used to work in the Local Brand Management industry. Our company had direct relationships with both Google and Yelp.
I can tell you that in years past, we considered Yelp to have higher quality reviews overall. Within the last 3 years or so however, that has begun to shift in Google's favor.
Not in terms of average review length; Yelp still wins there. But in terms of how "reliable" we considered ratings to be for our customers, Google has definitely overtaken Yelp as "The Standard".
Speaking personally as someone who was in that industry for 9 years: I check Google and take it with a grain of salt, but I NEVER bother checking Yelp. Good call-out for Eater though, that's my go-to for cities they've covered.
I do also have some insider knowledge about how Yelp worked with businesses... which doesn't improve trust. For all Google's faults, they just don't care about anyone no matter what, so in that sense they're very egalitarian 😂
For next SBSQ: can you give the behind the scenes story of Risky Business? And what led to its end? What’s next for you in podcasting?