

2026 World Cup Predictions
Who will win the 2026 World Cup? Odds for all 48 teams and 104 matches, powered by 100,000 simulations from PELE, Silver Bulletin's new soccer model.


JUMP → Ratings | Groups | Knockout | Bracket | Match Projections | Track Record & History
⚽ The latest World Cup predictions: Updated June 21, 2026
Belgium and Uruguay are making it messy while USA and others advance easily
Belgium drew with Iran 0-0 after Nathan Ngoy was sent off in the 67th minute. The result seemed to suit Iran perfectly well, which tends to play with a defensive mindset. In fact, all matches in Group G have ended in draws so far, including Belgium’s previous match against Egypt.
If Belgium beats New Zealand on June 26, they’ll advance. But what about another draw?
Let’s get nerdy here. 8 of 12 3rd-place finishers advance, which, as we’ve consistently said, is a generous format. One thing to keep in mind is that if every match in Group G were to end in a draw, Belgium might finish 4th, since they have only 1 goal so far. FIFA’s fair points play tiebreaker could even come into play because of Ngoy’s red card.
More likely, though, another draw would mean 3rd place for Belgium, with 3 points and a goal differential of ±0. We project that most 3rd-place teams with 3 points will advance, but some won’t. Apart from 3 draws, the other way to finish the group stage with 3 points is with 1 win and 2 losses. Usually, that means a negative goal differential. Long story short: 3rd place, 3 points and a 0 GD is probably good enough — but Belgium has no business being in this position in perhaps the weakest group in the tournament.
Meanwhile, Uruguay drew 2-2 with underdogs Cape Verde (who also drew with Spain!) in a result that creates some chaos in Group H. Uruguay could pull ahead of Spain on the head-to-head tiebreaker if it beats them on June 26, but that wouldn’t actually guarantee first place in the group because Cape Verde would finish with 5 points if it beats Saudi Arabia. The tiebreakers do get a bit complicated here so it’s nice to have a model to sort them out.
The order of finish in Group H is a big deal because the 2nd-place team faces the winner of Group J: likely Argentina. Cape Verde are actually now the most likely 2nd-place finisher in Group H, which would be a big break for Messi, et. al.
Other teams have had an easier time. The United States clinched advancement to the knockout stage after defeating Australia 2-0 on Friday. It’s been an unusually smooth path so far for a country that has long awaited its soccer breakthrough. See below for more details on the U.S.’s potential matchups in the Round of 32, but it’s likely to be a relatively favorable opponent.
Germany, meanwhile, has won Group G after Deniz Undav scored his second goal of the match in stoppage time to defeat Cote d’Ivoire. Germany had been on something of a down stretch after winning the 2014 World Cup, but our PELE rankings have been higher on them than the FIFA rankings, betting on reversion to their usually high level of performance.
Apart from USA and Germany, the other team to officially clinch advancement is Mexico. But Spain — who were much better today in beating Saudi Arabia 4-1 — have “virtually clinched”, as have Canada, Brazil, Morocco, Japan, Switzerland and the Netherlands.
The model adjusts its odds after each game, playing out the rest of the tournament 100,000 times while giving teams credit (or blame) for their performance so far. We don’t want to overpromise, and we have a small team, so expect one update per day, but you may occasionally see intraday updates after important matches. We’ve also been tracking injury updates, which are becoming a problem for some of the frontrunners.
For our methodology, see here.
See also: PELE International Football Rankings.
So, who’s gonna win the World Cup? While our model doesn’t deviate too much from the conventional wisdom, we don’t have teams in quite the same order. Each time we run the model, we play out 100,000 simulated World Cups, accounting for the difficulty of each team’s draw, meticulously calculating tiebreakers, and even the possibility of a dark-horse contender getting hot and unexpectedly being in top form.1 Let’s look at the PELE ratings and some specific adjustments that we’ve made to them for the World Cup.
Part I. Team and group ratings ⚽
Our baseline PELE ratings are adjusted in several ways for the tournament. First, we account for differences between PELE’s algorithmically calculated rosters and the actual, announced World Cup rosters. Thus, we correct for the impact of injuries or otherwise unexpected player absences.2
Second, we update each team’s rating based on the quality of their performance relative to PELE’s expectations for each match. For instance, while Mexico beat South Africa 2-0 in the opening game, this result was pretty much what PELE expected so it doesn’t produce much of a revision to the overall ratings. And third, we adjust for home-field advantage on a match-by-match basis.3 The factor is customized for each team: as it happens, the U.S., Canada and especially Mexico4 have above-average home-field advantages.
You can see the impact of some of PELE’s advanced features. Norway, for instance, receives a boost from Erling Haaland because PELE accounts for player market values.
You might have noticed that our table introduced some mascots: a fox5 (🦊) for Group F, for instance. (By the way, that’s a hedgehog 🦔, not a porcupine, for Group H.) We figured that might be helpful because with 12 groups this year, the group stage could be roughly as confusing as the Tokyo Subway Map. Here are all the groups, with their mascots, along with the pre-tournament composite ratings6 for each one.
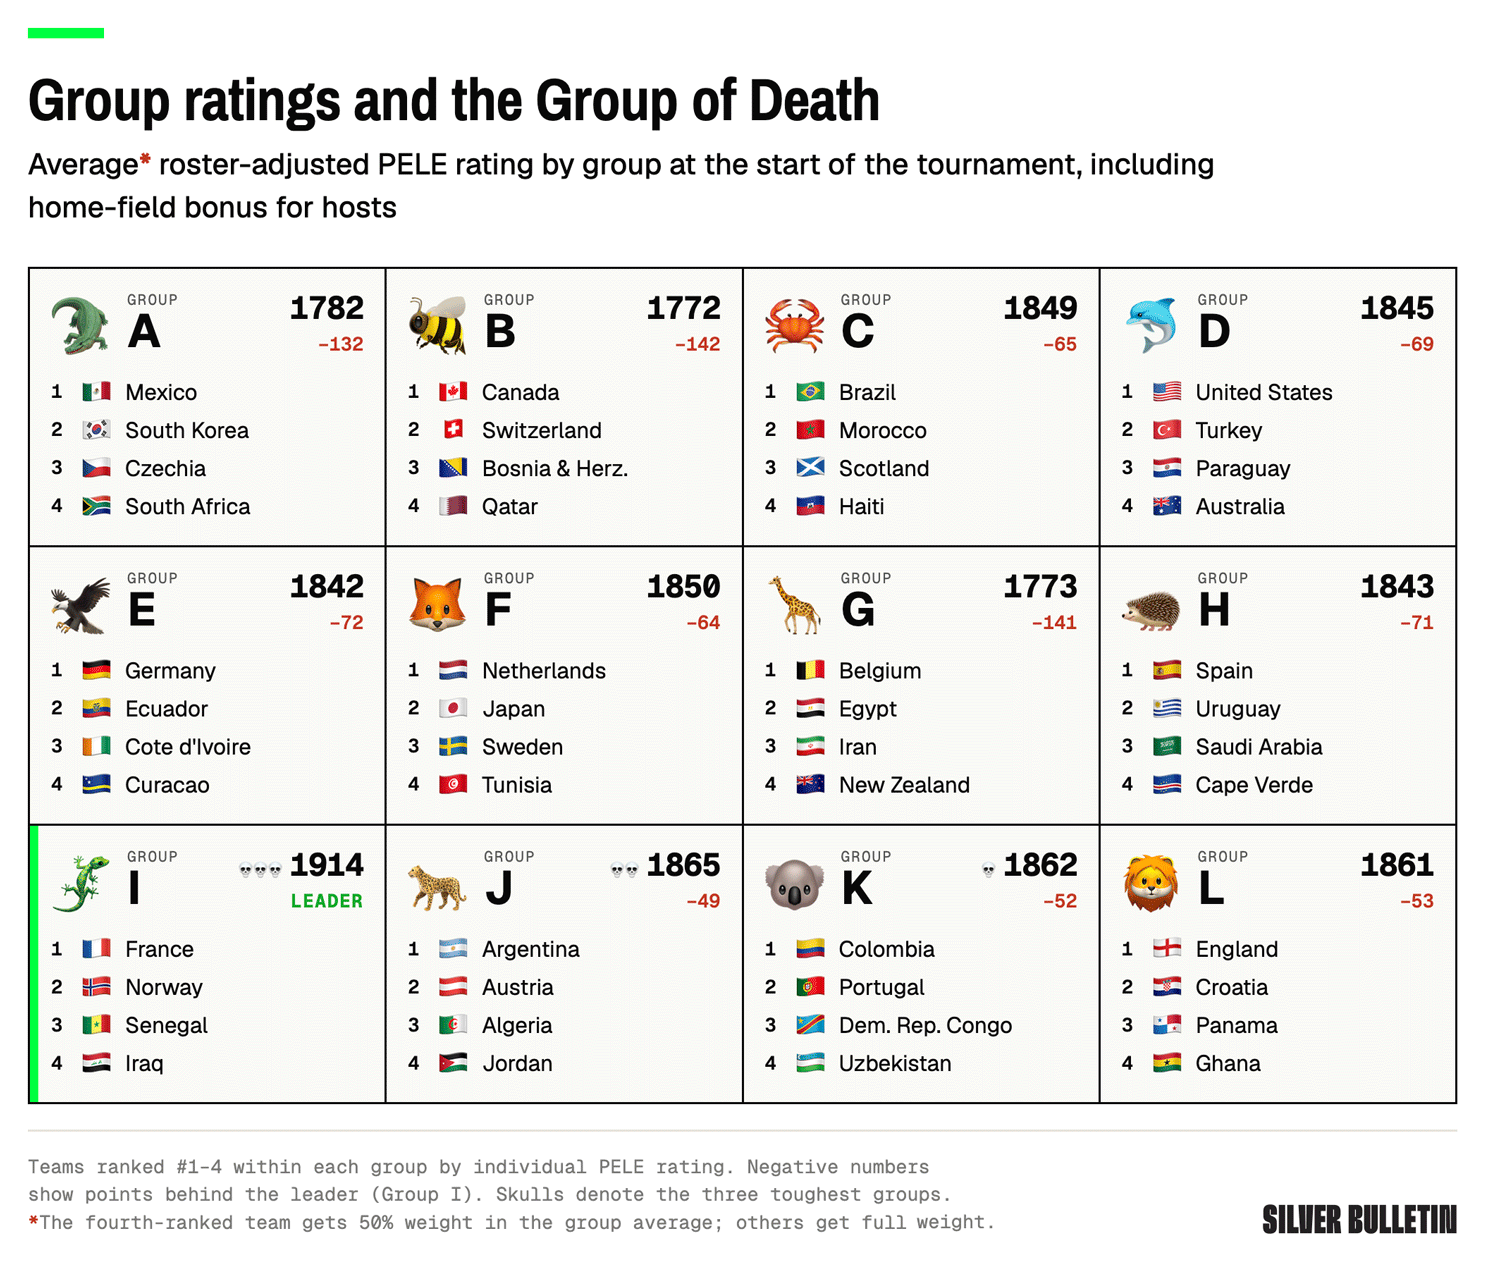
Some groups are tougher than others, particularly France’s Group I (🦎), which also features Norway and Senegal. Under the old format, this would be a proverbial Group of Death, but now all three teams have a chance to get through. The United States’ Group D (🐬) is also a little tougher than reputed, with no elite teams but also no easy outs. Canada and Mexico have among the easier draws in the tournament, however.
But let’s be honest: 32 teams out of 48 advancing makes for a forgiving format. (The eight highest-ranked of the 12 3rd-place finishers will go to the knockout stage along with the winner and runner-up from each group.) Yes, we put a lot of work into precisely incorporating FIFA’s complicated tiebreaker rules into our simulations. (Head-to-head results now take precedence over goal differential.) But no country that has any pretension of being a soccer superpower has a good excuse not to advance. The expansion from 32 to 48 teams also lowers the floor significantly, with teams like Uzbekistan, Cape Verde and Curacao potentially providing for easy group-stage fodder and possibly yielding a higher-scoring tournament.7
Let’s take the rest of this in phases. We’ve accounted for pretty much every detail that we can think of, from how teams’ odds of advancing will change based on the results of each group stage game to the biggest upsets in World Cup history:
Ratings and forecasts will be updated at the end of each match day8. As a heads-up, we’ll show all of you some data from the first four groups as a preview, but most of this incredibly detailed analysis is reserved for paying subscribers. (Paid subscribers will also get access to our full suite of PELE ratings and our forthcoming midterm election forecasts.)
Part II. Group stage projections ⚽
As we’ve said, 12 groups are a lot, especially with as much detail as we’re going to show you. So let’s pair our mascots off into squads of four, starting with Groups A through D, which include the three co-hosts. Here are the latest results of our 100K simulations.
We’ve opted to show you a lot of detail here because of FIFA’s complicated tiebreakers. Here’s what determines group stage placement, in precise FIFA order:
Points: 3 for a win and 1 for a draw
Head-to-head results between tied teams
Goal differential
Goals scored
Fair play points (FPP), or basically yellow cards and red cards: the fewer, the better for advancement (appropriately, this is the yellow column in the chart)
Finally, the FIFA rankings
So what exactly is each country’s odds of advancing? That’s in our next table: