

How we calculate our PELE ratings
Way more detail than you asked for on the methods behind our new soccer model.

Last updated 6/2/2026
PELE is Silver Bulletin’s rating system for international soccer teams. Each team gets two principal ratings: a PELE rating describing its overall skill level and a Tilt rating indicating its propensity toward attacking or defensive play. Based on these ratings, we can evaluate past match results and forecast future matches. PELE ratings are updated continuously and backdated to 1872 (!).
PELE is also the backbone of our 2026 World Cup forecast. The last section describes the World Cup-specific adjustments we’re making — though “regular PELE” and “World Cup PELE” are about 95 percent the same both in spirit and in practice.
We’re extremely proud of PELE, but it was a lot of work, and it’s not our simplest model. This article describes the system in detail.
The basics of PELE
PELE stands for Predictive Elo with Lineup Equilibria. We know it’s a little bit nerdy, but this backronym captures most of the essential features of the system:
Predictive means that the goal of PELE is to probabilistically forecast the outcome of future soccer games. These aren’t the FIFA rankings: we’re not interested in which teams are most “deserving” of a particular slot. Rather, we’re looking for factors that have a predictive impact. International football teams play relatively few important games, and some of the most predictive indicators don’t derive from match results alone.
Elo means that PELE shares many properties with an Elo rating system — and indeed, PELE ratings are designed to be comparable to Elo ratings such as the FIFA rankings or the World Football Elo Ratings.1 As with other Elo ratings systems, PELE ratings are updated iteratively at the end of each match, and updates are zero-sum. (If Brazil beats Bolivia 4-1, whatever gain Brazil makes in its PELE rating is offset by a loss of points for Bolivia.) However, PELE deviates from traditional Elo ratings in other important respects, as we’ll describe below.
Lineup means we use player market values and age data from Transfermarkt to help anchor PELE ratings. We look at the market values for the top 23 nationals2 with their respective club teams, with some soft positional constraints. For years since 2005 (when Transfermarkt’s coverage begins3) team ratings are gradually “nudged” toward team aptitude as estimated by these player values. Player ages, weighted by market value, also affect the system — younger teams are expected to improve, while older teams are expected to decline. PELE also uses market values to help calculate whether a team’s strengths are oriented toward offense or defense.
In addition to market value data, we consider each country’s region, GDP, and football legacy. (The regions are not based on FIFA’s six confederations; we’ve developed our own system of 12 overlapping soccer regions, which we believe to be more predictive and more geographically accurate.) But these other factors are less important after the introduction of Transfermarkt data in 2005.
Equilibria serves as a catch-all to capture some other important features of the PELE system. PELE contains many parameters that work together to converge on (we hope) the best possible ratings. But these two mechanisms are particularly important:
National team results essentially compete with the model’s expectations based on player market values, ages, GDP, region, and team history. The prior gradually pulls each team toward its long-run expectation based on these factors, while the match results push against this if a team consistently outperforms or underperforms PELE’s assumptions.
PELE calculates two sets of ratings for each team: an Elo-like PELE rating that measures overall squad quality, and a Tilt rating that indicates whether the team tends to be attack- or defense-minded. Tilt ratings are based on (1) whether games involving the team tend to produce more or fewer goals than the model’s expectations, and (2) roster composition. PELE and Tilt ratings can be combined with global scoring trends to derive a score matrix for each game, i.e., the probability that Germany wins exactly 2-1 over Australia, or ties it exactly 0-0, etc. These can be used to estimate win/loss/draw probabilities for any given matchup, or to impute offensive and defensive ratings for each squad.
Scope and coverage of PELE
PELE covers international matches between teams that were both FIFA members at the time. There is an exception for teams that played widely recognized international matches before FIFA was formed in 1904. We think of these pre-FIFA countries as the “Original Ten” (analogous to the NHL’s “Original Six”). They are England, Scotland, Wales, Ireland, Argentina, Uruguay, Austria, Hungary, Belgium and France. Matches between “B-teams” or played under significant roster restrictions (i.e., the Olympics in recent years) are excluded.
Relying on FIFA membership dates essentially outsources decisions about when a national team reached “maturity” to FIFA, an organization we have mixed feelings about. Nonetheless, this provides a semi-objective basis for articulating “official” games among the myriad matches that have occurred over the past 100+ years between 200+ national or sub-national entities. We tested various alternatives to FIFA membership dates, but they only slightly increased the number of PELE-eligible matches while adding more subjectivity. FIFA membership dates are researched precisely.
Nonetheless, we had some decisions to make, particularly regarding which national teams are considered to be continuations of previous teams. Indeed, nearly every political dispute of the past century shows up in some form in historical soccer data. In making these decisions, we tried to be as consistent as possible based on the history, geography and economics of countries being reformulated. FIFA regards West Germany as having inherited pre-WW2 Germany’s football legacy, for example, and considers reunified Germany to be a continuation of West Germany. Our definitions are stricter and treat major changes in national boundaries as discontinuous, such as the split and reunification of Germany, the formation and breakup of the Soviet Union, and the breakup of Yugoslavia.
However, minor changes such as Timor-Leste splitting from Indonesia are tolerated. There are inevitably some judgment calls: we consider the creation and collapse of the United Arab Republic to be a discontinuous event for both Egypt and Syria, for example. In some cases, countries are considered dormant or hibernating and then “reincarnated” if they return to roughly their original boundaries: for example, the Baltic states before and after the formation of the USSR.4 In addition to the 211 current FIFA members, we calculate ratings for 17 nations that were FIFA members at some point but are now essentially defunct, e.g., Czechoslovakia — though defunct teams are excluded from most of the charts we display. Overall, almost 50,000 international matches since 1872 are included for PELE consideration.
PELE Phase 1: “basic” Elo-type ratings
Within our model, PELE is calculated in two phases. The first phase is “simple” and empirically establishes our parameters, such as the regional coefficients or the varying importance of home-field advantage. The second phase introduces mean reversion toward PELE’s expectations based on Transfermarkt player values and other data. This section describes Phase 1.
Some features of PELE are very Elo-like:
Rating updates are zero-sum. Whenever a team gains ground from match results, this is offset by its opponent losing an equal amount of PELE rating points.
By definition, the average PELE rating for the 211 active FIFA countries is 1500.
PELE relies on contemporaneous information. In other words, Hungary’s rating on (for example) April 5th, 2012 is based on information that would have been available as of that date. We don’t go back and recalculate ratings based on post-facto information (i.e. Hungary lost to Norway, but it turns out that Norway was stronger than we assumed at the time).
Any Elo-type system also relies on a number of parameters that govern the overall behavior of the system. To the extent possible, PELE seeks to derive these empirically.5 The next section describes PELE’s approach to some of the most important ones.
Home-field advantage, match importance, and other parameters
We undertake highly detailed calculations for home-field advantage. In general, home-field advantage is very important for international soccer matches, and we think the impact of HFA is underrated by other systems. There are several components to our HFA calculations.
HFA varies over time, and this is derived empirically. In general, HFA increased after WWII, rose until the 1980s/1990s and has been declining since then, perhaps because travel accommodations for visiting teams are improving.
Travel distance impacts our HFA calculations.6 Traveling from Brussels to Amsterdam is less burdensome than flying from South Korea to Brazil. Travel distance is more important for neutral-site games.7
Altitude has a significant impact on teams like Mexico and Bolivia, who typically play their home matches at high altitude. These teams tend to have a significant home-field advantage because they are better acclimated to local conditions. Indeed, the formula is nonlinear. As you may have experienced yourself, engaging in intensive physical activity at 10,000 feet is more than twice as hard as at 5000 feet.
PELE also calculates customized HFA coefficients for each team. More precisely, these measure the spread in team performance, relative to PELE’s expectations, in home versus “nonhome” (neutral + road) games. Like the global HFA rating, each team's custom rating evolves over time. In general, teams in far-flung and war-torn places tend to have larger HFAs, while richer nations in Europe and the Middle East tend to have smaller ones. Bolivia has the largest HFA, mostly because of its altitude. But the customized HFA adjustments are generally pretty conservative; this data is noisy.
Another important consideration is the importance of each match. A friendly will be taken less seriously than a World Cup knockout game. Some previous research, including my own work for ESPN’s Soccer Power Index, suggested that low-impact matches nevertheless provide substantial predictive value. But the actual situation is more subtle. Low-impact matches, such as friendlies, tend to predict performance in future low-impact matches, and most of the dataset consists of these. However, high-impact matches like the World Cup or the Euros tend to better predict performance in future high-impact matches. We considered developing ratings on two parallel tracks (i.e., a friendly match rating versus a “serious” match rating), but it wasn’t quite worth the added complication.8 Instead, we use these importance factors to weight the value assigned to each match. There’s roughly a threefold difference between the most and least important games.
Friendlies: 0.5-0.7x9 multiplier
Minor and friendly tournaments: 0.7-0.9x
Regional tournaments and Olympics10: 0.7x (qualifiers)-1.0x (main tournament)
Continental tournaments (e.g. the Euros): 1.3x (qualifiers)-1.4x (main tournament)11
World Cup: 1.5x (qualifiers)-1.6x (main tournament)
In addition, matches that are eligible for extra time (generally, knockout-stage matches) receive an additional multiplier of 1.1. Thus, World Cup knockout-stage matches are treated as having an effective multiplier of 1.76.12
There’s another subtle consideration in PELE: friendly matches tend to slightly collapse the difference in team quality. England will treat a World Cup qualifying match against San Marino with more urgency than a friendly against the same opponent. This is also accounted for by the model.
Finally, PELE ratings include one other feature from Elo’s grounding in chess.13 Most chess ratings systems incorporate a provisional period for new players: their rating updates more rapidly during their initial matches. From an information-theory standpoint, the idea is that the “prior” we have about these players’ skill level is relatively weak, so we ought to be more aggressive about incorporating any data whatsoever from their actual match results. PELE does the same thing. When a new country14 appears in the match file, we weight its initial results more heavily through roughly its 100th international match15, allowing it to converge toward its steady-state rating more quickly.
Differences between PELE and true Elo systems
There are also some important ways in which PELE deviates from traditional Elo ratings.
Some Elo-type systems adhere to a strict principle: winning always helps your rating. In these systems, if England beats San Marino 2-1, England will see some (typically very modest) rating improvement, while San Marino’s rating will decline. The polar opposite is to train the model on the score differential. For instance, if England is expected to defeat San Marino by 5 goals, the 2-1 scoreline will reflect that England underperformed the Elo expectation by 4 goals.
PELE basically strives for a compromise between these. Rating updates are based on what we call harmonic margin16 or “h-margin”. In h-margin, each additional goal has diminishing returns: the second goal in a 2-goal victory counts ½ as much as the first one, the third goal counts ⅓ as much, and so on. This is particularly important in soccer, where the current score substantially affects tactics: if you’re already ahead 3-1, whether to press for another goal or to collapse into a more defensive shell isn’t obvious. Matches won in penalty shootouts — there is some skill in penalties, believe it or not — are regarded by PELE as basically halfway between an outright win and a draw.
Initial ratings and the geography of international football
In Elo-type systems, each team or player usually starts with the same initial rating, typically 1500, before playing any games or matches. However, this can introduce some information loss. To a large extent, which teams are strong at football is predictable. From first principles, for example, you’d expect Argentina to defeat American Samoa. Even if you’d never seen a soccer game, you’d know that Argentina is much larger, has a much longer football legacy, and comes from a region where football plays a much more prominent role in the culture.
Technically speaking, PELE ratings also start out with a blank slate (everyone at 1500). However, we iterate the ratings dozens of times to converge on what we call a “GDP prior” for each country. The GDP prior is based on three factors:
A country’s purchasing power parity GDP (adjusted for the standard of living) at the time it became eligible for PELE-rated matches. More specifically, we use the natural logarithm of a country’s GDP (there are diminishing returns to economic growth from a soccer standpoint). We use aggregate GDP, not GDP per capita, so both population size and living standards per citizen matter.17 Each country’s GDP is expressed as a fraction of world GDP at the time, so there is no bias introduced from when a country begins playing. Most of the GDP values are taken from the Maddison historical database, which is about 75 percent complete for the countries and years we care about. However, some GDP values are missing in Maddison: for example, Maddison lists the value for United Kingdom GDP rather than for the respective home nations (England, Scotland, etc.) while the home nations compete individually in football. The missing GDP values were filled in using Claude Opus 4.6, with careful oversight from yours truly. For the most part, this process is fairly straightforward. UK GDP can be divided between the home nations based on their relative contribution to the UK’s GDP, for example. Or we can estimate Estonia’s GDP prior to its being taken over by the Soviet Union based on the living standards at the time of comparable countries like Finland.
A country’s “legacy year”: that is, the first year that it or one of its predecessors became eligible for PELE-rated matches.18 A longer legacy correlates with higher performance even years later, although this is the least important of the three factors discussed here. For the Original Ten, the legacy year is the year of its first widely recognized international match; for all other countries, it’s the year they became a FIFA member. Countries inherit legacy year status from any defunct teams that substantially overlapped with their territory: for example, both Northern Ireland and the Republic of Ireland inherit unified Ireland’s legacy year prior to the Partition of Ireland.
Finally, we consider a country’s football region. PELE does not use FIFA confederations for anything: these do not correlate all that well with football performance, and can be influenced by political and other arbitrary factors. They can also be blunt instruments for continents as large as Asia. Instead, we crafted our own set of 12 regions, which deliberately contain some overlap. I’m going to be honest, we went through a lot of different versions of these.
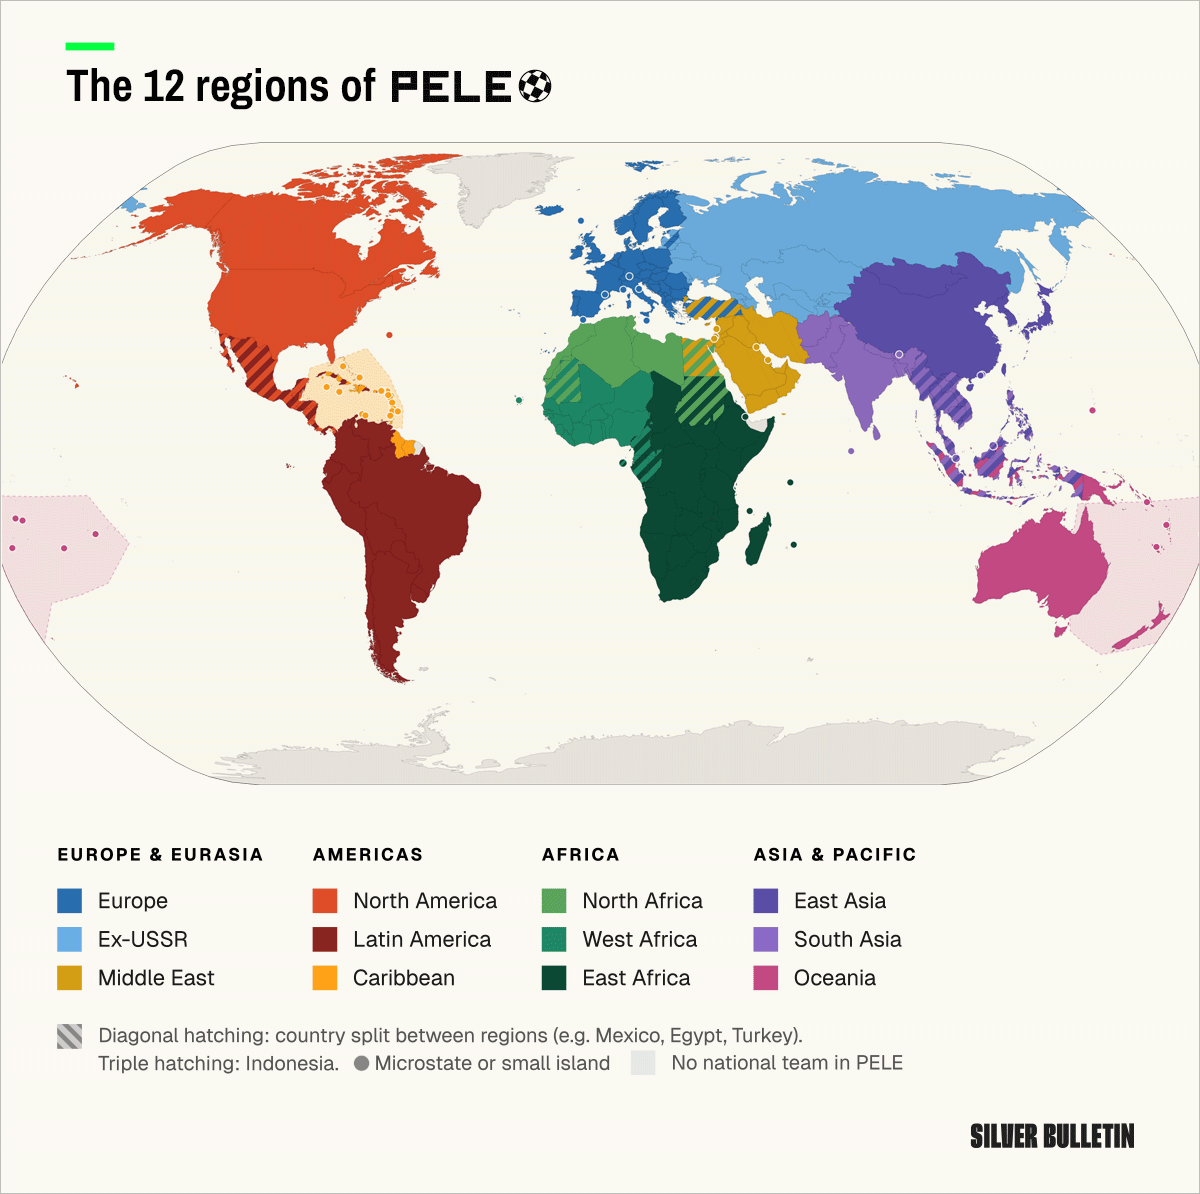
Basically, we started out with the six populated continents and then carved out some logical geographic boundaries to create more precision:
Oceania survives pretty much intact from conventional definitions. Note that Indonesia is considered a transcontinental country, belonging to both Oceania and Asia.19
The Americas are also self-contained, but the conventional boundary between North and South America doesn’t adequately reflect the cultural distinctions within the region (and how this tends to map to football strength). Instead, we divide the Americas into three regions: 1) North America, defined as the continental territory stretching to the Darien Gap, and 2) the Caribbean, and 3) Latin America. Eligibility for Latin America is defined as any country in the Americas where the predominant language is Spanish or Portuguese. We would have included French also (it’s a Latin language), but there aren’t any FIFA members per se that would qualify on this basis.20 The decision to split off the Caribbean was important. It’s not a terribly important part of the world football-wise. But the idea of the regional groups is that there should be a coherent economic or cultural tie that can inform our priors. And the notion that, say, Haiti’s football performance tells you anything whatsoever about Canada’s or the United States’s rating felt like a big stretch. Even with the 3-way split of the Americas, there is deliberately some overlap: Mexico, for example, is both a North American country and a Latin American country. (We’re sort of implicitly creating a Central America region, in other words, which takes the average of the Latin America and North American values.) Note that Guyana and Suriname are not Latin American countries despite being in South America; instead, they’re considered Caribbean countries.21 Only Canada, the United States and Bermuda22 are purely in North America.23
Next, we carved out a Middle East region based on its reasonably well-defined geographic boundaries. Most Middle Eastern countries are “taken” from Asia, which badly needs to be subdivided because it consists of so many unlike parts. However, the Middle East also has two FIFA members from Europe (Turkey and Cyprus) and one from Africa (Egypt, which is transcontinental due to the Sinai Peninsula). These countries are treated as hybrids between the Middle East and other regions.
The other big carveout is Ex-USSR, and we’ll admit that this one is more debatable. The Soviet Union existed for 70 years and affected football culture and development pipelines in ways that are still persistent today. Former Soviet Republics like Moldova are historically weak at soccer as compared to Europe — as is Russia itself, really, given its GDP. But the Central Asian ex-USSR countries are relatively strong as compared with most of Asia. (And Central Asia doesn’t fit neatly into any of our other regions anyway.) The Baltics — Estonia, Latvia, and Lithuania — are considered hybrids between the Ex-USSR and Europe because they were the only former Soviet countries to have football teams prior to the formation of the USSR. We avoid making exceptions based on political developments: Russia is at war with Ukraine, but the war is recent, and Ukraine isn’t (explicitly) a NATO or EU member.
That leaves Europe as everything in the continent outside the former Soviet Union. We considered some further divisions, e.g., lumping in some nations with ex-USSR into an “Eastern Bloc” region. But these definitions are fuzzy and historically contingent24 and footballing strength has historically been roughly even across Europe, especially once controlling for GDP. Both Western European countries, like England, and Eastern European ones, like Hungary, have strong football traditions.
Asia and Africa, on the other hand, are large and warrant further division. We already carved out the Middle East and the Asian parts of the ex-USSR region (basically Central Asia) from the rest of Asia. The remaining portion of Asia nevertheless spans a large landmass and more than half the world’s population. The logical division is between South Asia and East Asia. South Asian nations are almost universally underachieving at soccer. East Asia, conversely, contains some of our bigger outliers — notably, South Korea and Japan have become very good at soccer in contrast to the rest of the region. But China is underperforming. Still, priors are priors for a reason: they’re good default assumptions that are sometimes violated. We considered creating an “Asia-Pacific” region that would also include Australia, but this went too far down the road to gerrymandering based on footballing strength. However, Southeast Asian countries are hybrids between South Asia and East Asia in our scheme, so this creates another implicit region along the lines of Central America.
Finally, Africa is often treated as an undifferentiated mass by Westerners, but nearly all the stronger African sides you’d think of are either in North Africa or West Africa. These countries have different religious and cultural traditions and different relationships with colonial European powers that correlate with football strength. Therefore, Africa is divided into three regions: North Africa, East Africa, and West Africa, with some overlap. North Africa is reasonably well-defined by geographers, so we’re basically splitting the rest of the continent — Sub-Saharan Africa — into two parts. West Africa includes some of the continent’s strongest football countries. East Africa is a slight misnomer: it might be labeled East/Southern Africa if we were even more precise. But teams from that part of the continent don’t tend to reach the same heights.
In case you’re curious, the order of the regional coefficients in terms of how well they predict team quality is:
Latin America
West Africa
Europe
North Africa
Caribbean
East Africa
Middle East
Ex-USSR
North America
Oceania
East Asia
South Asia
This ordering might be surprising, but remember that these ratings control for GDP (and legacy year). Europe might be better than West Africa at football, but its teams have longer histories and it’s much wealthier; the residual coefficient for West Africa is (slightly) higher once you control for that. The Caribbean surprised us as a modestly high-scoring region, but it has many tiny countries that punch above their weight.
PELE Phase 2: advanced ratings with mean reversion and player market values
In traditional Elo-based systems, ratings only change after games/matches are played. Silver Bulletin’s other sports models, like COOPER, already violate this principle because ratings are partly reset or reverted toward priors at the start of each season.25 In international football, however, there’s no “season” per se. So instead, each team’s ratings are very gradually “nudged” toward PELE’s expectations every day based on PELE’s priors. The magnitude of the nudge was calculated by comparing teams’ Phase 1 PELE ratings with their PELE ratings two years later. This allowed us to determine which factors predicted changes in team performance.
However, this is a deliberately slow-moving process: it would take decades for an outlier like Japan to fully converge on its prior. Moreover, teams can push away from this pull toward the prior with consistently good match results. Elo-type systems use a “K-factor” to determine how much the ratings change in response to new results. In Phase 2, our K-factor is set slightly higher than in Phase 1; in other words, match results matter slightly more, giving teams an opportunity to offset the mean-reversion. In practice, the prior is relatively less important for countries that play many international matches, but matters more for teams that compete infrequently in important games.
Prior to 2005, this mean-reversion is just based on the GDP prior: in other words, a country’s GDP, its legacy year and its region. It doesn’t have much effect: regions and legacy years do not change at all, and with some exceptions like China, relative GDPs only change slowly. Thus, prior to 2005, the Phase 2 mean-reversion process barely has a discernible impact on the ratings.
Beginning in 2005, however, an extremely valuable set of data becomes available: player market values and ages as estimated by Transfermarkt. Transfermarkt is exceptionally comprehensive, to the point where we can basically estimate a snapshot of any national team’s market value for any given date since Jan. 1, 2005. These can have a big impact: Norway’s rating is clearly boosted by Erling Haaland’s presence, for instance.
The Transfermarkt data does require some work to process, however. While we could simply add up the aggregate market value for every player of a given nationality, this might introduce coverage bias.26 Furthermore, football matches are 11 players a side, so that France’s 200th-best player is better than Canada’s 200th-best player is irrelevant. Instead, we construct a 23-man roster for each past date. (World Cup rosters traditionally consisted of 23 players, although this has now been expanded to 26.) These rosters are populated in descending order of Transfermarkt values, with a hard constraint on goalkeepers (exactly 3) and some softer constraints on the other positions (a team can’t field a lineup consisting entirely of strikers). The starting 11 gets full credit for its market values, while the reserves (players #12 to #23) receive partial credit based on a sliding scale (the first several reserves get nearly their full market value; the end of the bench doesn’t). If a team doesn’t have enough players listed in Transfermarkt to fill out a 23-man roster, remaining slots are treated as having zero market value.
For the 2026 World Cup specifically, we’ll use actual team rosters rather than our guesstimates once they become available. These will account for injuries and player absences, and players who wind up on different countries than their primary Transfermarkt classification. For “regular” PELE, however, the rosters are constructed algorithmically.
We also compute team ages based on this data, weighting ages based on each player’s market value to their squad. For teams without full rosters, ages are adjusted toward a mean of 26.5 years. Younger teams are usually projected to improve, and older ones to decline.
One big question is whether Transfermarkt data is biased toward certain countries, and particularly toward Europe, since the most valuable club teams in the world are overwhelmingly concentrated there. We investigated this carefully. The original version of PELE made a slightly ad hoc adjustment based on which countries and regions tended to have players who stayed at home even though they would be skilled enough to play for a top-flight European club if they wanted to (for example, this is more common in Latin America than in Africa). But this introduced a somewhat subjective element.
We’ve continued to tinker with the method, but what we’ve settled on this this. In calculating adjustments to Transfarmrket values, we use an average of four regression methods:
Version #1 applies an empirically-derived penalty to the Transmermarkt valuations associated with players whose club teams are in UEFA. Note that this is based on the club teams of the players and not the team. If ~all of Argentina’s roster plays in Europe, they’ll receive the same penalty that a European club would. On the other hand, some teams like Japan and Mexico will have relatively strong players who opt for domestic leagues; they tend to be helped by this.
Version #2 instead applies a bonus to players whose club teams are in the Americas or in Asia/Oceania. This is similar to #1 in practice, but note quite identical. The Americas region is the most underrated by Transfermarkt, in terms of predicting future match results, followed by Asia. There is not much competitive club football in Africa but also not much evidence of bias.
Version #3, however, takes a “kitchen sink” approach with separate regression terms for the Europe, The Americas, Asia/Oceania and Africa. It’s technically the best-performing version of the regression, though it might be slightly overfit.
On the other hand, Version #4 omits the regional adjustments entirely. It’s basically a hedge or, if you prefer, a version of Bayesian shrinking. We have found some evidence of the Transfermarkt bias declining over time as its coverage becomes even more comprehensive.
Instead, we now just apply a ~30 percent discount to player values as listed on club teams in UEFA nations. This corrects for Transfermarkt’s modest pro-Euro bias and is more accurate empirically.
As of May 28, we also added another adjustment to the Transfermarkt ratings that accounts for what share of a team’s players participate in domestic club leagues. There is a small amount of signal here — having your players stay at home can be a sign of a solid pipeline and might create more chemistry for the national team — but it’s quite minor.
There’s one other subtle factor in calculating our historic ratings. Suddenly, a whole bunch of new data becomes available on 1/1/2005. Rather than easing into the new regime gradually, we found PELE performed considerably better in the early Transfermarkt era (~2005-2010) if we made a one-time step-function adjustment to team ratings on 1/1/2005 to account for the new data. Essentially, this step-function banks in 10 years of reversion toward the new, more informed prior. If you look very carefully at PELE’s historic ratings, you may see bigger changes in 2005 than in other years.
However, as valuable as the Transfermarkt data is, the “Phase 1” PELE ratings are already pretty smart based on match results and the GDP prior.27 The player data is certainly worth worrying about and aligns PELE with betting odds more precisely, but it’s an important factor rather than a dominant mechanism in the system.28
Tilt ratings and expected goals
So far, I’ve barely even described one of the most important features of our system: Tilt ratings.
When I created SPI for ESPN for the 2010 World Cup, our system had separate offensive and defensive ratings for each team, characterized as their projected number of goals scored and allowed per match. The offensive and defensive ratings could then be combined to project scores and calculate overall quality ratings.
While I think SPI was a smart system, I actually think this technique wasn’t well-suited to soccer. Unlike a sport like American football, offense and defense are fluid in the sport. There isn’t a distinct platoon on either side. And soccer is deeply tactical: a team might play completely differently with a 1-goal lead than a 1-goal deficit. A game between two quality opponents could easily turn into a tight match or a shootout.
However, we can evaluate which teams tend to be involved in high-scoring games. This is basically what Tilt does: it measures whether matches featuring the team tend to involve more combined goals for both sides (positive tilt) or fewer (negative tilt). So while PELE is our measure of overall team quality, Tilt is more a measure of mindset. In sporting gambling terms, you’d use PELE to set the point spread or the odds of a team winning, and Tilt to project the over-under.
However, having a positive or negative tilt rating isn’t inherently good or bad. Teams can succeed — or fail — with more attacking styles or more defensive ones. In fact, PELE and Tilt ratings are, by design, mostly uncorrelated (the cool kids would say they’re orthogonal):
We can, however, combine PELE and Tilt to project goals scored and allowed in each match. We do this in the round-robin table of the PELE landing page, for example, which simulates a round of matches on a neutral field between all of the 211 FIFA teams and all 210 of their opponents.29 A team’s projected number of goals scored and allowed against the round-robin are basically equivalent to SPI offense and defensive ratings, just with the process reversed:
SPI: Offensive rating + Defensive rating → Overall quality rating
PELE: Overall quality rating (PELE) + Tilt → implicit offensive and defensive ratings
This process can also be used to project the odds of a win, loss or draw between any two teams under any circumstance (home, road, neutral, etc.). Indeed, this is the process we’ll use for our probabilistic World Cup projections. But it is among the more complicated aspects of the system.
Our starting point is to create a projection of the number of goals in the match, derived from our database of nearly 50,000 historical results. The ingredients in this projection are as follows:
By far the most important factor: our rolling leaguewide baseline of overall goal-scoring in typical matches. Soccer has gone from featuring 4-5 goals per game at its inception to just 2-3 goals (combined between both teams) per match now. Our model calculates this baseline by averaging the past 5 years of data from all international matches, with a trendline term (is overall goal-scoring rising or falling globally?) and a correction that downweights outlier matches (Australia 31–0 American Samoa).
We also account for the difference in team quality, as measured by PELE.30 Matches between teams with large rating gaps tend to yield much higher scores.31
The importance of the match: more important matches tend to play tighter and feature fewer goals. In general in soccer, higher quality of play is associated with fewer goals: it’s completely different from something like the NBA in this regard.
And whether the game was played at a neutral site; neutral-site matches tend to play a little more wide-open.32
Next, we looked at whether there were systematic differences in scoring propensity, i.e. whether some teams tend to produce higher-scoring games beyond what their PELE rating might imply. Our Tilt ratings are the solution to this: Tilt is basically the difference between actual goals and expected goals based on our formula (regressed strongly toward a mean of zero because goals are rare in soccer and the raw signal is noisy). If matches involving Germany (canonically attack-minded) tend to produce higher scores than others, Germany will get a positive tilt rating, while a negative rating indicates a team whose matches tend to produce lower-than-expected scores like Senegal.
Tilt ratings have two subcomponents. Since Transfermarkt player data begins in 2005, we can sum up all the player values and allocate them to either offense or defense based on their positional assignments. As of mid-2026, for example, most of Norway’s value is concentrated on offense (Haaland) while most of Nigeria’s is on defense. The overall split is designed to be 50/50 based on these positional allocations:
The resulting effect on goal-scoring is what you might predict: teams whose strengths are concentrated on offense tend to produce higher scoring games.
The second component is tactical tilt. Figuratively, it’s whether a team prefers to play a more open/attacking style or a tighter, more defensive one, trends that can be persistent over decades based on the coaching regime and the soccer tradition in each country. More literally, it’s the residual number of goals scored relative to PELE’s baseline expectations.33 Tilt ratings are strongly hedged toward a mean of zero since measuring this attack/defense tendency is noisier than measuring differences in team quality.
The score matrix and future match predictions
From PELE and Tilt, we can project the number of goals for each team in any given match. Technically, the way the model does this is by first projecting overall goals based on leaguewide trends and each team’s Tilt rating, and then dividing the goals between the projected winner and loser.
But a projection like Spain 2.7-Finland 0.8 only tells you so much. Soccer is a low scoring game with a lot of draws, so the precise number of goals matters. Spain can score exactly 2 goals or exactly 3 goals or zero goals or some other integer, but they can never finish the game with 2.7 goals.
The Poisson distribution is designed to handle this sort of situation34 and is the traditional choice in soccer models. But it tends to have some problems. Particularly, Poisson understates variation too much, tending to underestimate both the number of draws (especially 0-0 draws) and the number of blowouts (Germany 7-1 Brazil). PELE’s solution35 is a negative binomial distribution with a correlation term. It’s not so important you know precisely what this means but that you capture this basic intuition: one team’s score affects the other team’s tactics. A 0-0 match tends to play tighter 75 minutes in than 3-2: it’s already been a low-scoring game but it will often play tighter still from that point forward. Our method does a good job of matching empirical goal-scoring distributions: e.g., there are about the right number of draws and blowouts in PELE.
PELE calculates a precise score matrix for each game (the chance Team A beats Team B by a score of exactly X-Y). It then sums up the cells in this matrix to estimate probabilities that the game ends in a win, loss or draw. For instance, here is the matrix for the United States’ first World Cup match against Paraguay on June 12, projected to be a low-scoring affair:
There are some complications introduced by extra time and penalty kicks, such as will be used in the World Cup knockout stage. Games eligible for extra time potentially increase the amount of gameplay by roughly 33 percent and empirically convey a slightly heavier advantage to favorites. PELE accounts for all of this. Historically, about 40 percent of draws after regulation are resolved in extra time before penalties, so PELE takes 40 percent of games projected to be draws in regulation and assigns a winner.36 The other 60 percent of extra-time games go to penalties.
Based on our analysis of several hundred past penalty shootouts, there actually is some skill in them; better teams and home teams tend to win shootouts more often, though edges in most situations are rarely more than about 60/40.
World Cup adjustments
PELE’s projections for the World Cup are based on a highly similar process to the one already described here. PELE already “forecasts” past games to help calibrate its ratings, and makes projections of future matches as described above.
So most of the work is just in applying the PELE process to the structure of the World Cup’s group and knockout stages. We very precisely simulate the group stage and knockout stage, typically 100,000 times per model run, including calculating each official tiebreaker and FIFA’s complicated process for assigning third-place teams to knockout-stage slots. Actual game results will gradually replace simulated ones as real World Cup matches are played.
There are, however, a few small tweaks we’ve made that only apply to our World Cup projections and aren’t used in regular PELE:
Instead of constructing a roster algorithmically, we select the best 23 players from among a team’s official 26-man World Cup roster. Mainly, this accounts for injuries, and players who are eligible to participate for multiple countries and where the default Transfermarkt nationality puts the player on the “wrong” squad. We examine the difference in Transfermarkt value between the algorithmic roster and the World Cup roster and apply a bonus or penalty to each team accordingly, based on our analysis of past World Cup rosters since 2006. In general, the differences are not all that large. In most cases, teams lose players that the algorithm would prefer rather than gain players who add more value. However the adjustments are fixed to be zero-sum across the 48 World Cup entrants so roughly as many teams gain PELE rating points from this process as lose from it.
We also account for injuries and disciplinary suspensions on a match-by-match basis, using publicly reported injury information. There is inherently some guesswork here in translating ambiguous media reports into predictions about who will and won’t be available for a given match. However, often these injuries are less impactful than you might assume because World Cup rosters are typically very deep. Teams also have some wiggle room since only the best 23 players out of the 26-man roster are used in calculating roster value.
For the third group-stage match day only, our World Cup simulation considers team incentives37:
If both teams would advance with a draw (but have not otherwise clinched advancement), they have strong incentive to essentially collude to keep the score low. While there are not many matches like this in the historical data, they’re quite low-scoring. The model reduces expected scoring by 1 combined goal in these games.
Conversely, if both teams need a win to have a chance to advance (but have not already been mathematically eliminated), teams have incentive to go for broke, and expected goal scoring is 1 goal higher than in the default PELE formula.
PELE simulates the expected number of bookings (yellow cards and red cards) for World Cup matches because this is used as part of FIFA’s Fair Play Points tiebreaker. (Fewer bookings is better.) These are not random: better teams tend to receive fewer bookings, but teams receive more bookings when against tougher opponents. Home teams receive fewer bookings, an advantage for the U.S., Canada and Mexico.
As in regular PELE, team ratings, including Tilt ratings, are updated at the end of each game based on a comparison of actual and expected h-margin. In other words, we run the simulations “hot”. Teams have an opportunity to overperform or underperform their pre-World Cup rating based on the results of both actual and simulated matchups, and this carries forward to the rest of the tournament. For instance, if Belgium wins 5-0 in its first group-stage match in simulation #12616, its rating will be revised upward for the rest of the tournament within that particular sim — or if Belgium wins 5-0 in its actual first match, its rating will improve for the rest of the tournament in all simulations. We use a slightly higher k-factor for our World Cup simulations than in regular PELE to account for short-term fluctuations in “form”. There is some evidence in the historical data that teams are slightly streaky over short periods.
There is an empirical tendency for World Cup group-stage matches to be more upset-prone than the default PELE formula expects, but knockout-stage games to be more “chalky” with favorites winning more often. We aren’t quite sure about the mechanism for this: it may be teams feeling “nerves” early, for instance, or group-stage incentives (often a draw is a good result) compressing team quality to some extent. Thus, our World Cup simulations account for this, applying a 0.9x multiplier on the difference in PELE ratings to group-stage matchups but a 1.1x multiplier to knockout-stage games. This makes a relatively small difference, but it means that the forecasted match projections listed on our World Cup page will not exactly match the ones listed on the PELE page.
PELE uses some very slow-moving league calibration factors, such as the total number of goals scored per game in competitive matches across global football and the overall default magnitude for home-field advantage. These generally take years to change, and so we just freeze them in place for the roughly month-long World Cup.
PELE adjusts for altitude as part of its home-field ratings: playing at altitude typically offers a significantly larger advantage to the home team. In regular PELE, we use a default altitude for each country. For the World Cup, we use the altitude of the specific venue for the match. Thus, Mexico has a larger HFA in Mexico City than in Monterrey, for example. Note that, despite teams often arriving at the World Cup venue weeks in advance to acclimate, we haven’t found any evidence that home-field or travel factors are any less important in the World Cup than in other tournaments.38
All other factors are the same. Knockout-stage matchups include simulations of extra time and (if necessary) penalties, but this is also true for regular PELE. We thought about building in an adjustment for rest days, but FIFA actually does a pretty good job of building in adequate rest between matches for each side.
Note, however, that each system has different means and standard deviations. PELE is strict about enforcing the norm that a 1500 rating = an average team, but the other systems are not. FIFA ratings tend to be lower across the board, for example. As a practical matter, it’s often easier to compare rankings (1st, 2nd, 3rd) rather than ratings (2100, 2055, 1992).
World Cup rosters traditionally had 23 players (now they have 26). Limiting the scope of PELE to the top players also limits the impact of coverage bias in the Transfermarkt valuations.
Technically, it began in late 2004, but it took a few months to ramp up to relatively complete coverage, so we just use 1/1/2005 as a clean cutoff date.
Another edge case is South Africa; we consider it to have been “dormant” during its long FIFA suspension/boycott during apartheid.
We do this by iterating the model many times until it solves for the right parameters. Still, it can help to have a few “universal” structural parameters that are essentially hard-coded; otherwise, you can wind up with a “too many moving parts” problem.
We also tested travel distance based on the number of time zones rather than the number of kilometers traveled, but this was inferior across all statistical tests.
We think this is basically because home versus road provides a lot of signal that travel distance is somewhat redundant with, whereas for neutral-site matches, travel distance is really all you have to go with. Both in theory and in practice, Mexico gets a quasi-home-field advantage when playing games in the United States, for instance.
Although if you’re actually betting on friendlies, considerations such as how seriously each side tends to take friendlies and what the incentives are in a particular match will be important to consider.
PELE weights friendlies and minor tournaments slightly higher if the teams involved in the game are bad, because otherwise these teams won’t have many important matches played at all. Any match that Andorra plays is its “World Cup” basically.
The Olympics do not qualify for PELE consideration in recent years because they mostly use U-23 rosters, but they used full rosters in some long-ago circumstances.
We were surprised at how little difference there was in the amount of signal provided by qualifiers for major tournaments and the tournaments themselves. Most countries take these games very seriously, using their best internationals.
This was not part of the original launch of PELE but was added on June 2, 2026 in advance of the 2026 World Cup.
Full disclosure: this was something we added a week or so after the initial publication of PELE.
Or a country which had been dormant for a long period of time, such as unified Germany.
PELE calculates this adjustment based on the geometric mean of the lifetime match number of both the country and its opponent. So if Bhutan in its 1st match plays Brazil in its 1000th match, we’re trying to balance the fact that this game is quite informative for Bhutan but no big deal for Brazil. This preserves the overall symmetry of the system: the net gain/loss of PELE points after any given match always sums to zero.
Because it’s actually derived from the harmonic series.
Yes, we tested separately using population and per-capita GDP. It didn’t help at all and made the model more complicated for no predictive benefit.
Originally, we used a linear formula for legacy year: in other words, the ~40 year gap between England’s first match in 1872 and the founding of FIFA in 1904 was treated as being as important as the 40-year gap between 1950 and 1990. As of 5/28/2026, we shifted to a logarithmic specification instead that flattens out the difference in the early years. The previous formula had produced a bit of PELE infatuation with England and the other Home Nations.
Indonesia is the only country split three ways (between South Asia, East Asia and Oceania). This is annoying, but reflects that Southeast Asia is already treated as a hybrid region between South Asia and East Asia, and Indonesia’s presence on New Guinea means that geographers usually also consider it partly in Oceania.
Haiti is often considered a part of Latin America, but it predominantly speaks Creole.
For what it’s worth, this follows FIFA’s standard, as Guyana and Suriname are members of CONCACAF (North America) rather than CONMEBOL (South America).
Bermuda sits at a much higher north latitude and is almost never considered a proper Caribbean country by geographers.
Mexico, etc., are cross-hatched with Latin America. As a believer in American exceptionalism, I don’t think there’s any good “comp” for the U.S., except maybe Canada. But actually, the coefficient for North America is weaker than the one for the Caribbean once you control for GDP. As a result, establishing a separate Caribbean region hurts the U.S. rather than helps it.
For instance, the Warsaw Pact only existed for about 40 years, about half as long as the Soviet Union, and all the countries in the Warsaw Pact had footballing traditions beforehand.
In the case of COOPER, for example, they’re reverted toward a formula based on conference strength and preseason rankings.
i.e., if even the most minor European leagues were included, but only the most prominent players from other continents were. Honestly, though, Transfermarkt’s coverage is remarkably comprehensive, especially from 2010 onward.
In a regression equation, the GDP prior has an R-squared of around .83 in predicting historical PELE ratings.
On average, the difference between Phase 1 and Phase 2 ratings is only about 25 PELE points.
Although, the round-robin simulations are weighted based on how many games each opponent played in the historical dataset and the importance ratings for those games. This means that teams in the round-robin table face slightly above-average competition, on average, relative to the entire cohort of 211 FIFA teams, because higher-quality teams tend to play more games, especially in major tournaments. Each team faces the same weighted schedule in the round robin, however, other than not playing itself.
As well as applying our various home-field adjustments.
Indeed, there is an exponential relationship between the PELE ratings gap and projected goal scoring.
We’re not quite sure why this is. Perhaps teams tend to become more risk-averse to protect a lead when they’re playing at home. Or perhaps it has to do with the officiating. But it shows up as a robust signal in the data.
The residual is calculated after lineup adjustments are applied. In other words, tactical tilt controls for the personnel on the pitch, along with the other factors I mentioned.
i.e., a situation where you know the average outcome of some variable (2.6 goals) but have to allocate them into discrete buckets of integers (0, 1, 2, 3, etc.).
I do need to give Claude Opus 4.6 a hat tip for proposing and testing a number of possible constructions for the score matrix until it identified one that matches empirical scoring distributions extremely well.
We introduced a slight change to this procedure after PELE’s initial release. Extra time is now simulated more explicitly by the model. We calculate a game’s likelihood of being tied after 90’ regulation using the regular PELE model. If the game is tied, the simulation then plays out extra time with the superior team being more likely to score a goal, just like it is during regulation. In practice, this means that the skill differential between teams is slightly larger in games that are eligible for extra time than those that aren’t — though keep in mind that ~70 percent of extra-time games go to penalties.
For clarity, these adjustments only apply if the same incentive applies to both teams. If one team would advance with a draw but its opponent wouldn’t, the opponent has no reason to cooperate.
If anything, in fact, HFA has been stronger empirically in World Cup matches than the default PELE formula predicts — though we don’t make any special adjustment for this.
Hi Nate, do you plan to publish each country's stage of elimination probabilities on a daily basis during the World Cup? We have developed a game (SoccerShares.nl) that builds on such probabilities and I would much rather use PELE results as input instead of bookmaker quotes.
1) I believe football manager data is a better source of publicly available player ratings.
2) Transfermarkt does not basing its ratings on player ability alone its based on a player's potential. Footballers peak at about 30, transfermarkt values peak at about 21, if Max Dowman replaced Marcus Rashford in the England squad this would be a massive downgrade but not according to Transfermarkt values.
3) You don't take into account heat, this will be a huge factor at this tournament.
All that said, very impressive model, I imagine it performs so much better than the last soccer model. Certainly the poisson replacement makes so much sense. What would be interesting is if we could use the same method to discount/markup expected goals so that we have a more accurate 'dominance?' heuristic to analyse a specific match.