

The NFL has entered the Scorigami Era
Superkickers, rule changes, dual-threat QBs and analytics are changing the sport — and producing weirder scores.

This article is free. But if you’re an NFL nerd, I’d strongly encourage you to sign up for a paid subscription for full access to ELWAY and QBERT. They’re a lot of fun, especially as we’ve continued to add new charts and data. And fingers crossed, but so far ELWAY has also been ahead of schedule at keying in on the success of teams like the Seahawks and Patriots.
I’ve never exactly not been an NFL fan. When I was 15, I even ran the equivalent of a neighborhood football betting pool.1 It would have been nice if those Lions of my youth had given Barry Sanders more than one playoff win.
Because of the league’s ubiquity in American culture, though, the NFL is the background hum that pervades every sports fan’s life. You’re always hearing it, seeing it — at the bar, the airport, the poker room — without necessarily really listening to or watching it. But suddenly, because of ELWAY and QBERT, I’m an avid fan of the NFL again. As with visiting a city where you lived as a kid, there’s an uncanny familiarity — that pizza place is still open? — but you also notice all the little changes.
For instance, with a fresh set of eyes, it’s easier to see why the NFL remains such a popular product with the modern, episodic viewer2 even as other sports have struggled to hold their audience. But it’s also a much different league than my teenage archetype. Take, for instance, the proliferation of final scores that read like high school locker combinations. For example: 36-29. 44-26, 44-22 (twice!). And that was just last week alone. These are not the scores of our pastoral football childhoods: the familiar 28-24s, 20-17s, and 21-13s generated piously by some sensible linear combination of 7-point touchdowns and 3-point field goals.
Of those scores last week, only 36-29 was officially a Scorigami, the term invented by the sportswriter and humorist Jon Bois for the first appearance of a score in NFL history. That’s because Scorigamis are a nonrenewable resource. What were once vast, untapped deposits of Scorigamis have gradually been strip-mined away, particularly since the introduction of the 2-point conversion in 1994. The remaining uncharted territory on the Scorigami map now requires dedication and creativity to reach, such as the 40-40 tie between the Cowboys and Packers or the Bills’ spectacular 41-40 comeback win over the Ravens in Week 1.
Nevertheless, I’m here to expand and revise the definition of Scorigami. 36-29 is still a scorigami even if it occurs again next week, I decree. You’ll notice I used a lower-case “s” there. A Capital-S Scorigami is the first instance of a particular score in NFL history. But a scorigami is any sufficiently weird, profane score, whether 2-0, 39-26 or 40-40.
And there are more and more of these. In the early days of the league, 77 percent of final scores were one of the following: 0, 3, 6, 7, 10, 13, 14, 17, 20, 21, 24, 27, 28, 31 or 34 points. Those represent every combination of zero to four touchdowns (with a successful 1-point conversion) and zero to two field goals. Now, only slightly more than half of final scores are one of those totals. The number 68 might have been the yardage on Jaguar kicker Cam Little’s recent record-setting field goal. But if an NFL game ends with a final score of 68-11 this Sunday, it honestly wouldn’t feel that weird.
Thus, I’m here to dub 2025 as the dawn of the Scorigami Era in the National Football League.
There is, for one thing, a lot of scoring. The new NFL is prolific. At 46.6 points per game3, this year is tracking to be the third-highest-scoring season in NFL history (and, for what it’s worth, offenses generally improve as the season wears on). Everybody is getting in on the fun. While passing yardage has declined from its peak, quarterbacks are contributing more from the rushing game than ever. Kickers are making the impossible look routine. Rushers are averaging 4.4 yards per carry this season, close to the all-time high of 4.5 YPC from 2022. And kickoff returns are a thing again.
But as with origami, the second half of Bois’s portmanteau, the new NFL is precise. Coaches are finally nailing intricate 4th-down and 2-point-conversion decisions, long the bane of every NFL stat nerd’s existence, and strategy throughout the drive is changing in anticipation of a conversion attempt. Meanwhile, teams are stingier than ever about turnovers, and drives are longer as offenses efficiently string together a series of low-risk, medium-reward plays.
And yet, the net effect of the Scorigamified NFL is a little peculiar, as we’ll see.
NFL offenses are even more prolific than they seem
In working on projects like QBERT, which tracks all QB performances since 1950, and ELWAY, which dates back to 1920, you develop a sense for when there are phase changes in the sport. Some of these are even hard-coded into the models in various ways. When you’re working on a model, there’s often a trade-off between drawing the window further back because it gives you a larger sample size, or essentially chucking out the “old” data because it describes a regime that no longer exists in quite the same form.
One cute little thing we do in ELWAY, for example, is simulate discrete final scores. The raw form of the algorithm, for instance, might draw from a probability distribution to simulate a “score” like Chiefs 29.1, Broncos 22.6. Obviously, you could just round those numbers off: Chiefs 29, Broncos 23 is a perfectly plausible score. However, even in the Scorigami Era, scores like 30-23 or 28-24 or 28-21 are considerably more likely. (Not to put too fine a point on it, but these small differences matter when projecting the likelihood of a given point spread being hit, for instance.)
I won’t bore you with all the details, but essentially, ELWAY solves this problem by drawing from a database of 1 million simulated games played under our best estimates of modern NFL conditions. Each team gets a discrete number of drives, which might result in 0, 3, 6, 7 or 8 points — or occasionally, 2, 6, 7, or 8 points for the other team in the event of a safety or a defensive TD.
This is trickier than you might think because the home and away teams’ scores are interrelated. Especially late in the game, the current game score profoundly affects strategy: teams with leads run out the clock while trailing teams go for broke. The object of the game isn’t strictly to maximize the number of points scored, but to score at least one more than the opponent. In our simulations, a team trailing 21-13 late in the game will never kick a field goal on its final possession, for instance, and it will always go for two if it’s lucky enough to score a touchdown.
Still, the backbone of ELWAY’s simulations is basically this:
Excluding possessions where the clock runs out on the half, these are essentially the eight ways that an NFL drive can end. So it’s important to know the relative frequency of these outcomes. And that’s been changing a lot. As compared with the start of the millennium from 2001-2005, teams are scoring considerably more touchdowns and field goals (but missing slightly fewer FGs as kicking accuracy improves). They’re also punting less and committing fewer fumbles and interceptions — although they’re turning the ball over on downs more often because of a much higher propensity to go for it on fourth.
Overall, the average drive so far in 2025 is producing slightly more than 2.1 points, as compared to 1.6 points over the 2001-2005 window. That’s roughly a 33 percent increase. And that’s huge. Larger than the 28 percent increase between when the NBA bottomed out at 91.6 points per game in its 1998-99 season to its high-wattage 117.0 PPG (!) so far this year.
But there’s a “trick” that keeps this offensive explosion hidden. In football, successful drives run more time off the clock: a 17-play, 88-yard scoring drive might take up fully half the quarter, while a four-and-out can occupy less than a minute of game time, especially since incomplete passes stop the clock while completions usually do not4. So far this year, each team is averaging 10.5 drives per game, compared to 12 drives per game as recently as 2013. Thus, even though overall scoring has increased, the net increase in final scores considerably understates the gains in offensive efficiency.
Where do these gains in scoring efficiency come from? One important factor is that the field has essentially been shortened on both ends.
So far this year, following opposing kickoffs, teams have taken possession of the ball a tick downfield from their own 30-yard line on average. And this is the best starting field position they’ve had in years. The reason is the NFL’s dynamic kickoff, introduced last year. The new kickoff was designed to incentivize returns while reducing the possibility of injuries. In 2023, the last year of the traditional kickoff, 73 percent of kickoffs went for touchbacks because most modern kickers can boot the ball deep into the end zone, and returning teams generally wouldn’t bother with the marginal cases anyway lest they risk an injury.
Last year, 64 percent of kickoffs resulted in touchbacks all the same, even though the touchback was moved to the 30-yard line. But this year, the touchback has been moved out further to the 35-yard line, reducing the touchback rate to just 17 percent. Interestingly, this further tweak has only improved field position by about half a yard on average; kickers are becoming more adept at finding the corners of the landing zone. Still, possessions following kickoffs are starting around 7 yards further downfield than they did a decade ago.
If you’re starting at, say, the 33-yard line, you’re now really only two first downs away from being within field goal range because field goal range basically starts at midfield. As I’ve learned the hard way — I’ve, uh, lost a few bets recently this way — kicking off at the end of the half with say 20 seconds left on the clock is suddenly quite dangerous. The offense starts with the ball somewhere around its 30 … two quick completions … 59-yard field goal attempt … boom, game (probably) over.
Kicking efficiency has been improving for years, but relaxed restrictions around so-called K-balls this year — kickers basically get to use a fresh-out-of-the-box ball instead of one scuffed up by game action — has been an accelerant. If kickers like Little (who also kicked a 70-yard FG in a preseason game this year) and the Cowboys’ Brandon Aubrey are exceptions, it’s only by a few yards’ worth of distance. The rate of field goal attempts of 55 yards or more has increased by 135 percent compared to just four seasons ago, in 2021. And the number of makes from 55-plus has tripled in just four seasons. I’m guessing we’re in for some mean reversion — but so far on the year, kickers are actually converting 64 percent of their attempts from super-long-range.
But let’s not give too much credit to those kickers. I’m of the view that the value of quarterbacks, if anything, is a little bit understated by the conventional wisdom.
Quarterbacks aren’t quite putting up the gaudy counting statistics that they did a few years ago. Despite the 17-game schedule, no QB has passed for 5000 yards in a season since 2022, and none are on pace to do so this year.
Part of that is that QBs are opting for shorter, safer routes with exceptionally high completion percentages and little risk of interceptions. The average number of yards per completed pass is 10.1 this year, which is tied with 2023 for the lowest in NFL history.
However, advanced statistics like QBERT suggest that this risk aversion is probably smart for once. The league’s collective unadjusted QBERT rating is 89.6 this year, which is the second-highest ever behind an outlierish, pandemic-affected season in 2020.5 And in traditional NFL passer rating, quarterbacks are tied for their highest-ever rating at 93.6.
QBERT and passer rating differ ever-so-slightly in how they approach moving the ball downfield versus efficiency — QBERT is actually slightly more forgiving to old-school, gunslinger-type QBs — but it’s not a big difference. However, QBERT also accounts for a QB’s rushing contributions, as well as fumble and sack avoidance, whereas traditional passer rating does not.
Having, at the very least, some scrambling ability is now the norm rather than the exception. Thus far in the 2020s, starting quarterbacks have averaged 316 rushing yards6 per 17 starts, nearly twice the yardage they accumulated in the 1980s and 1990s. For the first time in NFL history, quarterbacks as a collective are gaining enough rushing yards to outweigh the yards they lose from sacks (even though this has also been a good era for pass rushers).
QB rushing touchdowns and first downs have increased proportionately. The latter category is particularly important; QBERT really likes quarterbacks who run for first downs. (Which helps to explain its Jalen Hurts fetish, for example — in 2023, he was second among all players in rushing first downs, including running backs.) The reason is that these plays produce a big gain in expected value. They often come on third down, and successful scrambles often reflect bailouts from what would otherwise have been negative-yardage sacks. The recent going rate of about 1.4 QB rushes for first downs per start might not sound like a lot, but those are often drive-saving plays.
Strategy is becoming more precise, especially on 4th down
In 2013, the New York Times launched its 4th Down Bot. It dutifully analyzed every 4th-down play and found, in line with a long lineage of work by academics and independent analysts, that teams were much too conservative, punting and kicking field goals when the rewards outweighed the risks if they’d simply entrust their offense to pick up a few more yards. 4th Down Bot last tweeted in 2017, claiming it was “tired” and moving on from the project.

Honestly, I’m relieved that our robot overlords still need days off. But I can’t exactly blame 4th Down Bot for feeling frustrated. Up through 2017, there had been no increase at all in 4th-down attempts despite all this research; if anything, they’d been declining slightly, perhaps due to some high-profile “go-for-it” calls that didn’t work out so well.
But like an artist who only becomes famous posthumously, 4th Down Bot, if it were resurrected today from its final resting place in a GitHub repository, would find that it hadn’t been wrong, only ahead of its time.
In 2017, NFL games averaged 1.8 4th-down attempts and 0.8 successful conversions. However, so far this year, those numbers have ballooned, roughly doubling to 3.1 and 1.8, respectively.
Note that this data is for both teams combined, so each team has approximately one successful 4th-down conversion per game in today’s NFL. Still, that goes a long way toward explaining why teams are stringing together longer drives. The success rate on 4th downs is also increasing. After consistently hovering around 50 percent for most of the league’s history, the 4th-down conversion rate has improved to 59 percent over the past two seasons.
The increased success rate is partly due to the tush push and other QB sneak plays. On fourth and very short — one yard to go or less — teams are opting to run about 75 percent of the time, and they’re converting 75 percent of those rushes as compared to 55 percent of pass attempts.
The data strongly suggests that teams should be running more; rushing plays are also converting at a higher rate than passes on 4th-and-semi-short (2 or 3 yards to go) and even at longer distances through the occasional draw play (although the sample sizes are small). At the same time, the precision of the short-yardage passing game is still enough to prevent the defense from keying in too much on the rush.
Other than mixing in even more runs, there may not be all that many gains left to be had from improved 4th-down strategy. In Week 10 games as analyzed by ESPN Analytics — basically the modern successor to 4th Down Bot — teams made the algorithmically correct decision 84 percent of the time on 4th down last week on plays where there was a material amount of difference in win probability7. And a handful of the “incorrect” decisions — mostly by the Philadelphia Eagles — were actually disliked by the bot for being too aggressive rather than too conservative.
Planning ahead for 4th-down attempts can also make the rest of the series more efficient. Compared to historical baselines, teams are now passing more on 2nd down at all yardages, but are actually running (slightly) more on 3rd down.
This makes sense if you work backward through the decision-making process. Take a typical 2nd-and-6 or 2nd-and-7 situation. If a team has only two downs to play with because it’s going to kick on 4th, it may figure it has to run or else it’s basically taking the running game out of the equation for the rest of the series (6-7 yards is a lot to ask for from a rushing play).
From a game theory standpoint, it’s always costly if your opponent knows what type of play you’re going to run. But if you’re planning on going for it on 4th, running on 3rd-and-semi-long situations (3rd-and-6, 3rd-and-7) can potentially set up a 4th-and-short. Meanwhile, on 2nd-and-short, you now have basically a free play downfield since you’re almost certain to convert given two opportunities to do so.
That’s especially true for teams like the Eagles that succeed in short-yardage situations at exceptionally high rates. They’re now basically facing a 1st-and-9 rather than a 1st-and-10 at the start of every series; that’s a huge advantage, although maybe one that ELWAY and QBERT are having a little trouble grasping.8
The rate of 2-point conversions has also increased, although progress in this direction has come in fits and starts. When the 2-point conversion was first introduced in 1994, teams played with their new toy fairly often. But the number of 2-point attempts per game fell from 0.25 per game in the debut year to just 0.07 by 2006.
Moving the 1-point conversion (extra point) line back to the 15-yard line in 2015 inspired more aggression because an extra point was no longer as much of a sure thing. Since 1994, 2-point conversions have had a 48 percent success rate (and this hasn’t really changed much9), thus producing 0.96 points per play. In terms of expected value — granted, not always the most important metric since the particular scoring margin matters a great deal for optimal strategy — the 2-point conversion produces fewer points if a team converts 99 percent of its extra point attempts. But if it only makes 95 percent of its extra points, about the rate since the rule change, the 2-point conversion results in slightly more points on average.
Why are there more weird scores?
The combination of more 2-point conversions and occasional missed XPs has a profound effect on the incidence of scorigamis. So far this year, 14 percent of touchdowns produce either 6 or 8 points, rather than 7. With 5.3 touchdowns per game combined between both teams, that means the typical game produces at least one TD that doesn’t result in adding 7 points to the scoreboard.
Granted, “typical” is doing a lot of work there, because unconventional conversion situations can come in bunches. If a team misses an XP and thus trails by 8 points prior to scoring, it will be much more likely to go for two following a touchdown. Still, this can contribute even further to funky scores. Say a team trails 17-9 and scores a TD. It will probably go for two. But if it fails to convert, it will be sitting on 15 points and is then basically past the scorigami event horizon for the rest of the game, with final scores like 18, 22 or 29 points becoming likely.
Even without any of this 2-point conversion business, the proliferation of field goals has contributed to scorigamis. So far this year, there have been 36 games where a placekicker made three field goals in a game, along with 18 instances of 4 FG games and six where they made 5 FGs. Overall, teams now score three or more FGs about 20 percent of the time, and the resulting scores are inherently scorigami-friendly. Three field goals produce 9 points, which is the same as a TD (with a plain-vanilla extra point) plus a safety.
A final factor in the scorigami singularity is simply the overall increase in scoring. Nearly all the capital-S Scorigamis that have filled in since 1994 have been high-scoring games. From the dawn of professional football through the start of the Super Bowl Era in 1966, the most common final score was actually 0 points. In fact, it was more common for a team to finish with exactly 2 points — so a safety and nothing else — than relatively common modern scores like 29 points or 40 points. Since 2000, only 10 Scorigamis — the exceptions are 58-0, 28-2, 36-3, 47-3, 52-3, 24-5, 31-5, 37-5, 38-5 and 52-6 — have been produced by the losing team scoring 7 or fewer points.
On the higher end of the range, however, new NFL overtime rules are providing additional Scorigami opportunities as each team is now guaranteed at least one possession under most circumstances.10 A game that ends 35-35 in regulation was once very likely to result in either a 38-35 or 41-3511 final score, neither of which is a Scorigami. However, the new rules open up additional possibilities like 43-42 or a 42-42 tie.12
Let’s compare four distributions of final scores:
The empirical distribution in what I’ll call Early Pro Football from the founding of the APFA (the predecessor of the NFL) in 1920 through 1965;
The Classic Super Bowl Era from 1966 through 1993;
The Modern Super Bowl Era from the introduction of the 2-point conversion in 199413 through today;
And finally, the simulated distribution of final scores from ELWAY, which is calibrated based on our best estimates of current scoring rates, strategies and overtime rules.
In Early Pro Football, 77 percent of final scores were one of the canonical scores I mentioned earlier — 0, 3, 6, 7, 10, 13, 14, 17, 20, 21, 24, 27, 28, 31 or 34 points, everything that results from 0-4 TDs (with an extra point) and 0-2 FGs. The rate of canonical scores declined only slightly to 72 percent in the Classic Super Bowl Era. But it has been just 62 percent so far in the Modern Super Bowl Era, and we expect that to decline further to 55 percent going forward based on ELWAY’s simulations of current conditions. There is an even more profound effect on both teams finishing with unusual scores.14
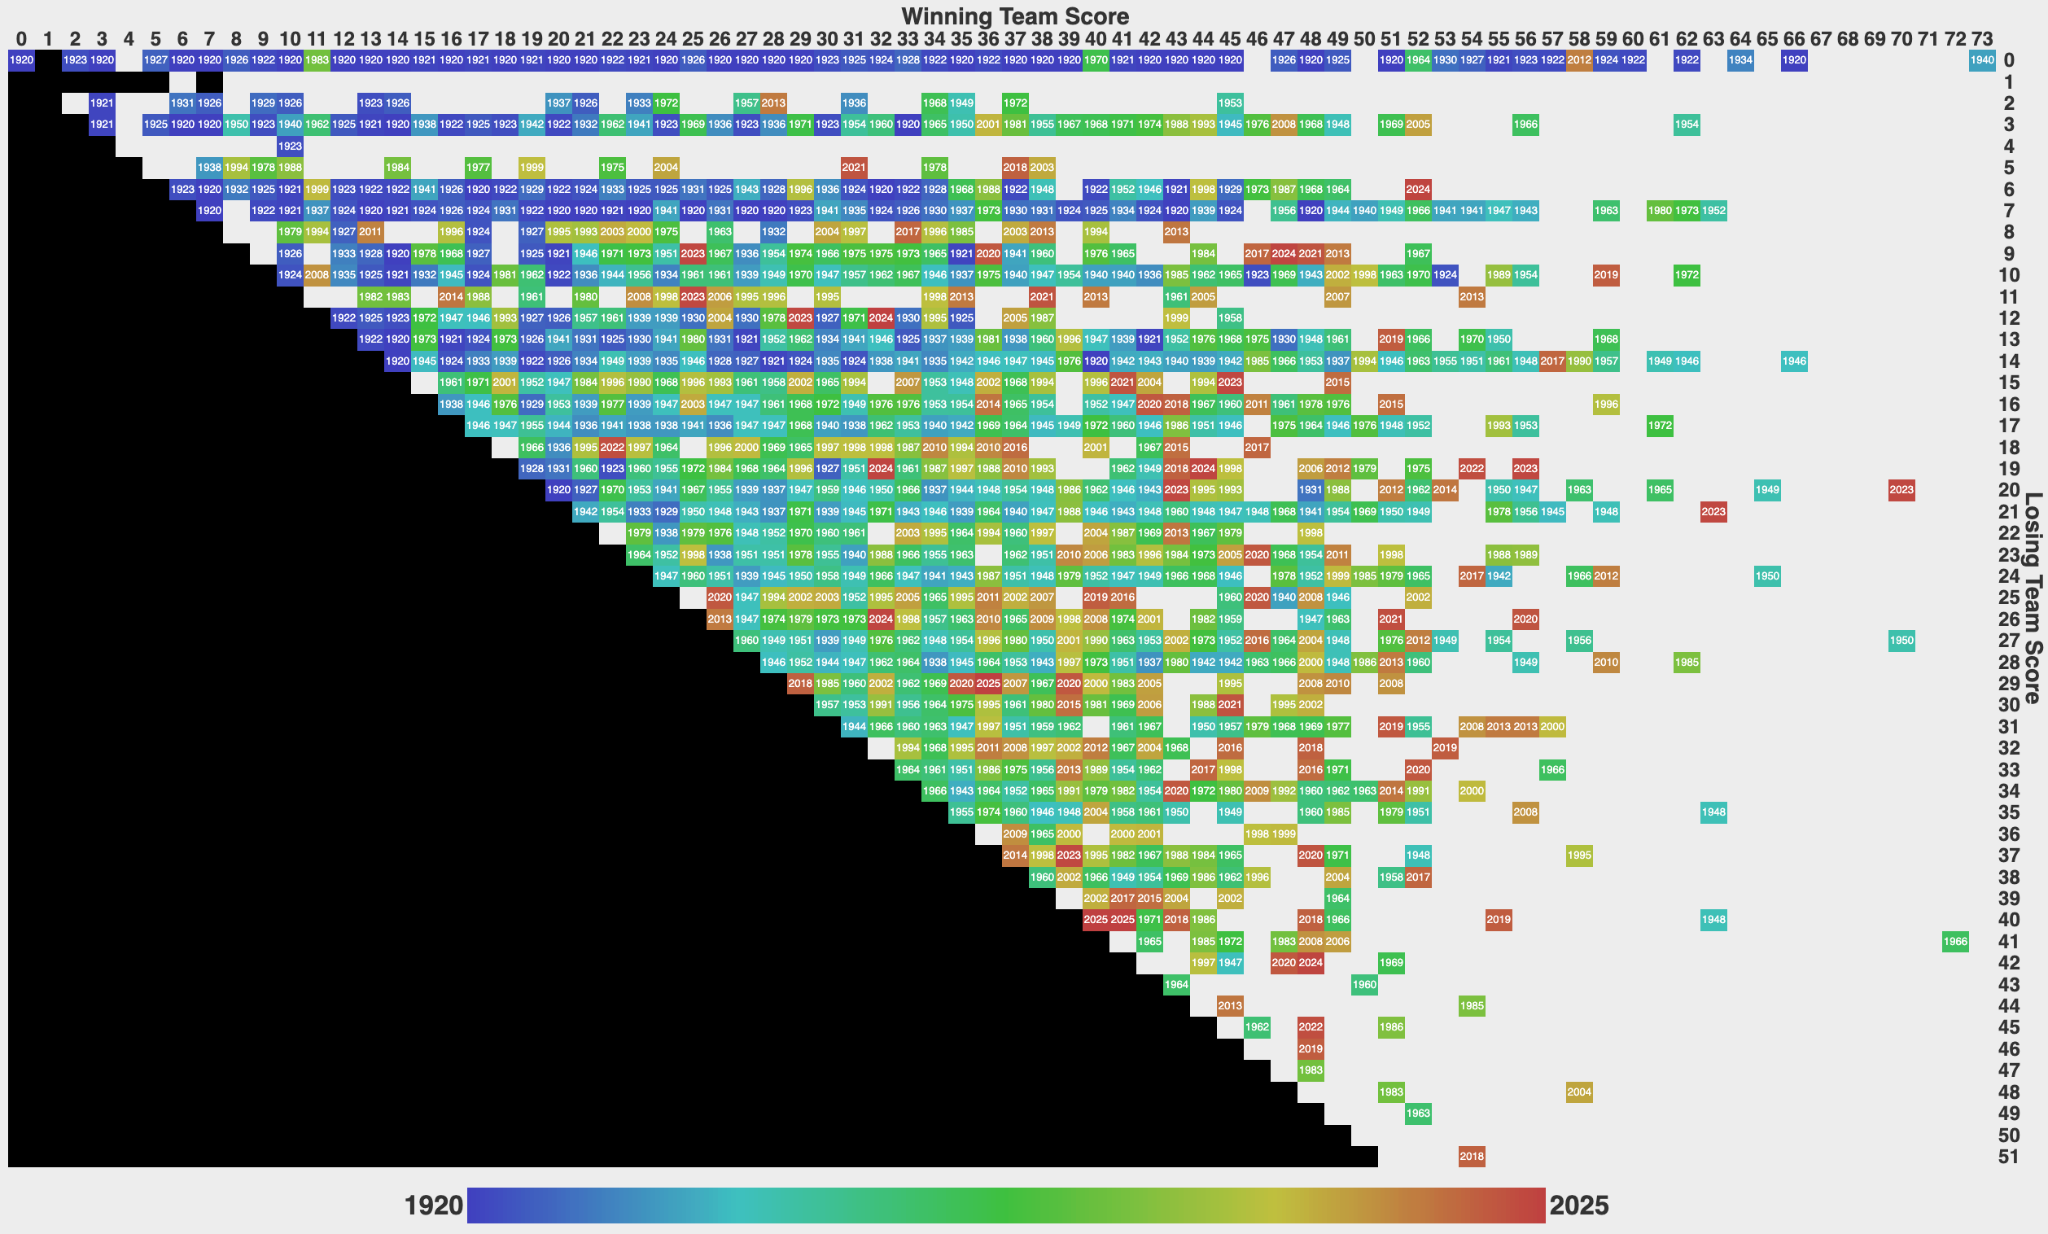
So what part of Scorigami Territory is likely to be conquered next?
The most likely unrealized Scorigami is 36-23 – honestly, not that weird a score — which has about a 1-in-1400 chance of occurring in any given game according to the ELWAY sims. Among scores where the losing team scores a touchdown or less, the most likely options are 27-8, 39-6 and 29-8. Among ties, your best bets are 25-25 and 22-22.
Overall, the chance of a Scorigami is only 2.7 percent in any given game, which means the over/under line is roughly 3 Scorigamis for the rest of this season. But in the Scorigami Era, every NFL game has the potential to produce feats of prolific and peculiar scoring that you’d never have imagined in your childhood.
Not quite as degenerate as it sounds. If I’m remembering right, the entry fee was no more than $20. In exchange, each participant would get a non-replenishable budget of 1000 “units” to bet with, with a minimum bet of 5 units per game across a series of college football and NFL point spreads. A friend who shall not be named once delivered a perfect sheet to my (physical) mailbox — going 20-for-20 for something — after I’d been away for the weekend on a debate team trip. Even Young Nate knew this was implausible and the contest did not last much longer from that point onward.
The league, I’d argue, has just about the perfect amount of inventory: 285 regular-season and playoff games compressed into 22 weeks makes every football Sunday feel a little bit special. Not quite as special as the opening weekends of the NCAA tournament, but getting there. The level of commitment required to feel on top of things in the NFL — you can watch several games each week, or even several games at once, without it particularly disrupting your weekdays — is quite manageable even for people like me who like to think of themselves as impossibly busy.
Most of the numbers in this column were calculated prior to the Patriots-Jets game on Thursday night.
Except for plays out of bounds in the last two minutes of the first half and the last five minutes of the second half. Prior to 1990, all out-of-bounds plays stopped the clock.
All games in 2020 were played in front of few or no fans. That reduced the impact of crowd noise, which tends to hurt offense more than defense by producing more false-start penalties, among other reasons.
Excluding yards lost from kneels.
A difference of 1 percentage point of win probability or more.
As compared to the conventional wisdom, QBERT is high on Jalen Hurts, but not all that bullish on the Eagles overall. It’s possible that we’re giving too much credit to Hurts for his tush pushes as compared to the Eagles’ O-Line and offensive scheme.
Although I suspect, given the increased success of 4th-down rushes, that teams could convert more often by upping their percentage of rushes on 2-point conversion attempts.
Except in the event of a defensive touchdown, safety, or if the team with the first possession burns the entire 10-minute OT clock.
Teams don’t kick extra points if they clinch the game in overtime or if the clock has run out in regulation.
The former is more likely because the optimal strategy when you score on the second possession in OT is generally to go for two, so long as there’s still time on the clock; otherwise, your opponent gets the ball back again.
1994 is also an important break point for other reasons; it coincides with the introduction of both full-blown free agency in 1993 and the implementation of the salary cap in 1994.
Largely because you’re multiplying two unlikely possibilities together. If each team has a 25 percent chance of finishing with a non-canonical score, there’s just a 1 in 16 chance that they both do, but if it’s 50 percent instead, the combined chances are 1-in-4. Note that these calculations assume independence between each team’s score; in practice, the score of the game at any given time affects strategy, as the ELWAY simulations attempt to account for.
Nate, this is an exceptionally fun article.
Behold, the sexiest football drive possible: 16 plays, 68 yards, 8:38 time of possession, kneel down, end of game.
https://www.espn.com/college-football/playbyplay/_/gameId/401135287
"Points? 𝗙𝗨𝗖𝗞 points. We have the lead and the ball. We are declaring this game over. Stop us if you want to."
And they didn't! They didn't want any part of it! The softies wanted to go home.
In my foolish undergrad days watching Pac-10 football, I thought the point of an offense was to score, ideally a touchdown. This is *an* important skill for an offense, but it is not the only or the most important skill.