

Is the vibecession real — or is the survey broken?
A shift to online polling and undersampling of Republicans are skewing America’s most-cited measure of consumer sentiment.

Today’s newsletter is a guest post from Joel Wertheimer. Joel is a civil rights attorney in New York and has served as a policy consultant to political candidates. He worked for President Obama from 2015 to 2017 as Associate Staff Secretary. He irregularly writes about data, soccer and politics at wertwhile.substack.com.
For nearly four years, the internet has debated whether we’ve been mired in what Kyla Scanlon dubbed a “vibecession” — whether people feel worse about the economy than the underlying data suggests they “should” feel. People as esteemed as Nobel laureate Paul Krugman have frequently posted about the vibes mystery. Nate wrote a whole piece about the divergence in the New York Times two years ago.
But there’s one big problem with the discussion: most of the participants are relying on a broken survey, the University of Michigan’s consumer sentiment survey (“Index of Consumer Sentiment” or “ICS”), that is in dire need of being repaired. Failure to correct for these issues has led to plenty of pet theories — but they explain a trend that may not even exist.
On Friday, the survey reported a 49.5 reading for consumer sentiment, a number that, while slightly improved from last month, puts it below the depths of the Great Recession. But without properly correcting for the survey’s issues, the headlines are misleading. No, Americans are not as unhappy about the economy as they were during the Great Recession.
What’s wrong with the University of Michigan survey
The University of Michigan ICS is the gold standard sentiment survey measuring consumer sentiment.1 The survey has historically shown a very strong correlation with “hard” economic data such as inflation and unemployment. But before more bad analysis gets done on the vibecession, people need to know they’re working with dubious data. As with election polls, the ICS has struggled amid a shift away from telephone polling. There are issues both with partisan nonresponse, with some political groups more likely to respond than others, and partisan expressive response, with survey-takers using questions about the economy to express political sentiment.
So the problems with the ICS are these:
The switch to online polling made responses more negative and,
There are too many Democrats in the sample.
Thus, ICS data since mid-2024 is not comparable to past periods. Here is the partisanship of the sample over time:
And Democrats right now say they hate the economy with Trump in charge.
When adjusted for these issues, the ICS should be substantially higher than the Great Recession lows we have witnessed over the past year. Weighting the survey to Pew’s National Public Opinion Reference Survey — what Nate Cohn called “perhaps the most important poll you’ve never heard of” — would place the ICS at a level more like that in 2013, when the economy was growing after the Great Recession but unemployment remained stubbornly high and wages stubbornly low. This adjustment would bring the survey in line with other measures of consumer confidence, such as those from the Conference Board, Gallup, and YouGov.
The online version of the ICS finds more negative sentiment
Some background on the ICS: for most of its existence, the survey was conducted by phone and weighted to demographic variables: age, sex, race, education, income, and region. Beginning in April 2024, the University of Michigan began a phased transition from phone to web polling, becoming fully web-based by July 2024, as response rates to telephone polls plummeted. Michigan was meticulous about the switch and polled both by phone and online for a period to establish the validity of the online polling method, finding a .97 correlation between the phone and web series.
But as Ernie Tedeschi and Ryan Cummings have noted at Briefing Book, that came with a seemingly permanent level shift in the survey, of nearly nine points down. A high time-series correlation only means the phone and web series moved together; it does not rule out a persistent level shift, with web respondents consistently registering lower sentiment. If every group’s economic outlook declines roughly uniformly, the correlation will hide that.
After controlling for respondents’ demographic characteristics across the web and phone versions, Tedeschi and Cummings found that the mode effect was very strong. The correlation that the University of Michigan found is still there, but web survey takers persistently expressed much more negative views than those reached on the phone (a well-documented phenomenon in other surveys). They found a persistent downshift of almost nine points. My own similar analysis found a similar, although slightly smaller shift.
But there’s also another problem.
The ICS has too many Democrats
We all know that partisanship drives much of how people respond to polls about the state of the economy. And as partisanship has continued to increase over the past two decades, the effect on the survey has become more pronounced.
Under George W. Bush, partisanship led to a 15-point gap between Democrats and Republicans, controlling for demographics. By Obama’s second term, it was over 20 points. In Trump’s first term, it was 38 points, and that number was similar under Biden. But so far during Trump’s second term, the gap between partisans equates to nearly 53 points of consumer sentiment.
These partisan shifts might balance out — Democrats might be too bearish about the economy under Trump relative to the objective underlying facts, but Republicans would counteract that by being too optimistic. However, since Trump’s re-election and the mode switch, the Michigan survey has largely failed to capture Republicans’ views.
How come? The devil is somewhat in the details. The ICS uses a rotating panel design. Part of the sample is “fresh”, but a respondent can be reinterviewed up to three times.
But over the past two years, more Democrats have been recruited into the sample, and Republicans have fallen out. Moreover, Democrats who respond at the reinterview stage return at much higher rates than they did during the phone survey, whereas Republicans only return at slightly higher rates — in fact, the strongest Republican voters2 are following up with re-interviews less than they did during the phone era. Taken together, this has led to a huge partisan shift in the ICS sample.
Joanne Hsu, who runs the Michigan survey, tackled this question on May 22: “Are the relatively dour readings seen in recent months being disproportionately driven by Democrats?” she asked. “A closer inspection of data on multiple dimensions of the economy reveals a resounding no.” She defended that position by noting “Sentiment readings nationally […] continue to be fully aligned with the views of independents.” She produced this chart in support of her view:
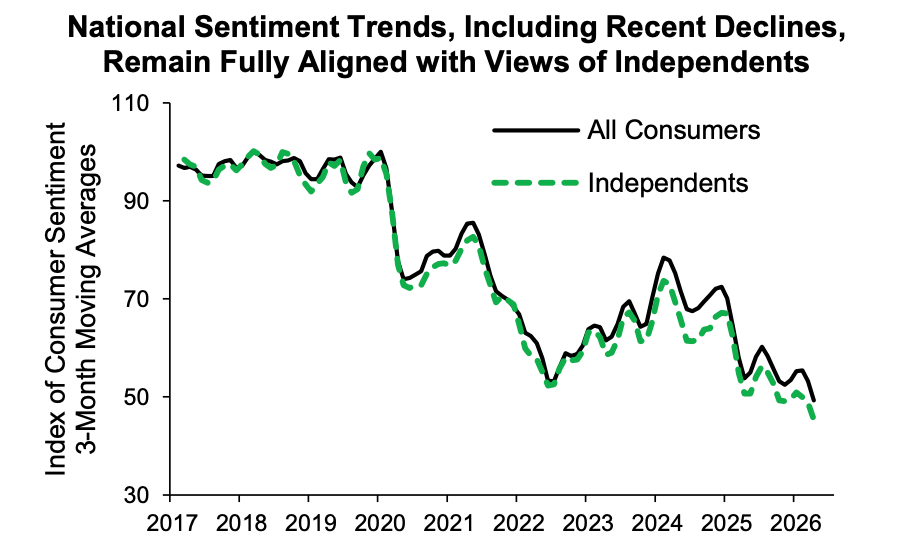
But Hsu’s chart doesn’t tell the full story.
Just for a quick-and-dirty comparison, without applying any demographic controls, I took UM’s published data by party and compared it to the topline ICS. In my chart, the dashed green line represents a panel that’s evenly split between Democrats, Republicans, and independents — while the blue line shows a skewed sample of 50 percent Democrats, 25 percent Republicans and 25 percent independents.
As you can see, prior to the mode shift, the overall ICS figure (in black) matches the balanced, ⅓-⅓-⅓ panel extremely well. But since the mode shift — and the 2024 election — the survey tracks closely to the blue line, with a panel that has twice as many Democrats as Republicans.
It might be true that independents are relatively bearish on the economy. But that doesn’t explain away the partisan skew. Independents often express dissatisfaction with the political system and the direction of the country — that’s part of why they don’t affiliate with one of the major parties. Also, as Democrats have soured on their own party’s leadership, many Democratic-leaning voters now identify as independents but still usually vote blue. (Kamala Harris actually won independents in the national exit poll in 2024 despite losing the popular vote.)
What’s more, independents had a much more negative response to the mode switch than Democrats or Republicans:3
The Michigan survey tracks others — if you remove the mode and partisan biases
It’s understandable that surveys might want to adjust for party affiliation. Although what party a voter is registered with is verifiable data4, most polls instead ask respondents which party they prefer. This is a political attitude, and it can change over time.
Fortunately, we do have a very high-quality survey called the National Public Opinion Reference Survey that can address this issue. Published periodically by Pew, NPORS is an annual address-based survey, with paper, online and phone response options and financial incentives. It has a much higher response rate than most contemporary public-opinion surveys and is used to benchmark many other polls.
It is true that partisanship shifts over time, but the trend was towards more — not fewer — Republicans in 2024 and 2025:5
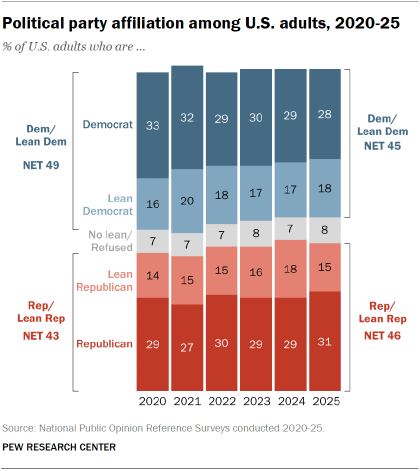
Pew also publishes the microdata (individual responses) from the survey. Using this data, I reweighted the ICS to reflect the actual partisanship of American adults, in addition to the mode adjustment described above. When both adjustments are made, ICS is still low historically — but not depths-of-the-Great-Recession low. Instead, it looks more like the numbers during Barack Obama’s first term, when he was re-elected with a weak but growing economy:
Notably, these numbers look a lot more like the Conference Board’s Consumer Confidence Index:

For some further validation, I found Gallup and YouGov polls that ask respondents whether they are better off or worse off financially than they were a year ago, and compared them to an adjusted number6 from an identical ICS question.7 With these adjustments, the Michigan series moves pretty much exactly like the YouGov and Gallup numbers.
The conclusion is simple: the ICS cannot continue to ignore its sample’s skewed partisanship in the future. And people who write about consumer and voter sentiment shouldn’t ignore the problems either. President Trump is highly unpopular, and, in contrast to his first term, his economic numbers are worse than his overall ratings. But the Michigan survey exaggerates just how sour consumers are feeling about the economy – the vibecession is partly an artifact of bad data.
The Michigan Index of Consumer Sentiment is calculated by standardizing positive and negative responses to five questions: (1) Would you say that you (and your family living there) are better off or worse off financially than you were a year ago? (2) Do you think that a year from now you (and your family living there) will be better off financially, or worse off, or just about the same as now? (3) Do you think that during the next twelve months we’ll have good times financially, or bad times, or what? (4) Looking ahead, which would you say is more likely — that in the country as a whole we’ll have continuous good times during the next five years or so, or that we will have periods of widespread unemployment or depression, or what?, and (5) Generally speaking, do you think now is a good or bad time for people to buy major household items?
That is, voters who fully identify as Republicans rather than “leaning” toward the party.
Whether Democrats and Republicans would have changed differently if a Republican had been president at the time of the mode switch is unclear.
Although not all states have partisan registration, and voters can switch their registration, of course.
I suspect we’ll see meaningful moves back towards Democrats in the 2026 NPORS when it is released.
The mode effects were even stronger for this subcomponent.
As described in the first footnote, this question is one of five inputs into ICS’s headline consumer sentiment number.
 | A guest post by
|
This is a strong piece, and the core thesis is clearly true: the Michigan survey has become a partisan thermometer, and the post-2024 readings can't be taken at face value. I argued something similar about the survey's inflation-expectations component in a Bloomberg column, so I'm sympathetic. But I have three objections.
First, the adjustments explain the wrong thing. The mode shift and the partisan reweighting both land after mid-2024. The vibecession is older than that. Kyla Scanlon coined the term in 2022, under Biden, when — by your own partisanship chart — the sample wasn't yet Democrat-skewed and the survey was still on the phone. The puzzle that launched four years of commentary was sentiment running below what 3.5% unemployment "should" produce. The corrections pull the recent readings up toward 2013 levels; they don't touch the 2022 divergence. They explain the depth, not the phenomenon.
Second, subtracting nine points to match the old phone series assumes phone was unbiased and web is contaminated. But self-administered modes are well documented to reduce social-desirability bias — people are franker to a screen than to a live interviewer. If web respondents are simply more honest, the level shift is signal, and it was the phone series that ran high. As the piece argues, a 0.97 correlation between modes can't adjudicate this. The same goes for anchoring to a fixed NPORS partisan split: it partly defines away the partisan-driven sentiment you're trying to measure.
Third the piece addresses Hsu's claim that the national number tracks independents. But her main argument, in the May 22 note, is that partisan gaps are "economically important and meaningful," showing up in actual spending, entrepreneurship, and portfolio choice. If partisanship moves behavior, then partisan-skewed sentiment isn't expressive noise to weight away — it's a forecast of consumption. You can't treat the partisan signal as meaningless for the index and meaningful for the economy at once.
Which gets at what the vibecession actually is. These instruments measure central tendency, not perceived variance. "Continuous good times, or periods of widespread unemployment, over the next five years" asks about the mean, not the felt second moment. Someone can rationally say things are fine now but the ground feels less stable than before 2020 — pandemic, Silicon Valley Bank, Iran War, an oil shock, tariffs, AI displacement, DSA making a bid to take over the Democratic party while MAGA is showing signs of life after Trump — and that depresses sentiment without being partisan or irrational.
The vibecession reads more like a fragility premium than a happiness deficit. The clearest evidence is the present-versus-expectations gap: okay now, worried ahead. The Conference Board's split between its Present Situation and Expectations indexes captures that directly.
None of this rescues the headline. 49.5 is not a true Great Recession reading. But "partly an artifact of bad data" is too clean — part of it is a real signal the instruments aren't built to measure.
The inconsistency of date ranges on the charts makes the analysis raise my eyebrows a bit. Looking at the charts, they go back to:
* 2006
* 2016
* "G.W. Bush", so 2001-2008?
* N/A - not your chart
* 2022
* N/A - point in time
* N/A - not your chart
* 2017
* 2007 - not your chart, but the data is publicly available to make it shorter/longer
* 2009
Some of these may be benign in intent (e.g. you want to highlight a more recent trend, or not all data series are available for the full time window) but shifting the window of analysis on every single chart smells a lot like cherry picking to make the data fit your conclusion.
Take the chart "Consumer sentiment looks less negative after adjusting for mode and partisanship". It goes back to 2017, but the leading text references earlier dates in Obama's term ("depths-of-the-Great-Recession", "when he was re-elected"), so reader's can't even see that in the data.