

Turnout didn’t cost Kamala Harris the election
In fact, marginal voters preferred Trump. So Democrats need to find a new playbook.

Two quick announcements. The World Series of Poker began yesterday and continues through mid-July; I’ll be there beginning the week of June 9. Although I’m not going to send out a separate email about it, I’ve revised and improved the guide to the WSOP that I wrote last year. It’s particularly aimed at people who have some proficiency at poker but haven’t played the WSOP very often, a category I fell into before I became a regular at the World Series.
Also, May has sure gone by fast, which means it’s almost time for edition #21 of Silver Bulletin Subscriber Questions. You can leave questions in the comments of last month’s SBSQ.
Presidential campaigns — and particularly Democratic campaigns — tend to see turnout as their lodestar. There are a number of reasons for this:
First, a large number of Americans who are eligible to vote for president don’t do so. About 89 million people who could have cast a ballot in 2024 didn’t, for instance, considerably more than the number of votes received by either Donald Trump (77 million) or Kamala Harris (75 million). So, from first principles, it makes some sense to focus on this large group as compared to the considerably smaller number of swing voters.
Second, turnout is something the campaigns believe they can influence at the margin through voter outreach and volunteer participation, such as phone banking and door-to-door canvassing. A lot of people are involved in these efforts, as compared to the smaller number who craft messages and ads. So, there’s a morale-boosting element from championing turnout.
Third, there’s probably a degree of motivated reasoning. Democratic campaign operatives are generally (much) more left-wing than their party’s voters. So they like strategies that imply candidates can win by motivating the party base, rather than pivoting to the center. Left-leaning media outlets often echo the same themes.
Finally and most importantly, Democratic campaigns have long believed that marginal voters — that is, people who vote infrequently — tend to vote blue if and when they do cast a ballot. Until relatively recently, this was a robust assumption. From my long experience analyzing polling, I know that polls of likely voters routinely used to be more Republican-leaning than polls of all adults or registered voters, implying that Democrats would benefit from a higher turnout. (This assumption was even baked into our election models.) In the Trump Era, however, this pattern has reversed. Democrats routinely overperform in low-turnout affairs like special elections, while Republicans do better in high-turnout presidential years.
But a new, highly detailed analysis of the 2024 vote from Catalist, an analytics and voter database firm, suggests that turnout was probably a relatively modest part of the problem for Harris last year.
I say “probably” because essentially all of this data is calculated by inference: by calibrating voter participation records against inferential data and demographic analysis from large-scale surveys. Also, Catalist is a Democratic firm. Still, their analysis is generally considered the gold standard even by Republicans, putting far more detailed data into the public domain than is usually available. Nor does their data contain good news for the party; rather, it finds that Harris and Tim Walz performed poorly among the exact sort of infrequent voters that Democrats once counted on for higher turnout.
2024 was a high-turnout election (by American standards)
But let’s back up a second, because there’s something you might not realize if you were following the narrative on Election Night: 2024 was a high-turnout election. It takes a long time to count the vote in the United States, particularly in mail-voting states — here’s looking at you, California. So the totals reported on election night can massively underestimate the eventual totals. In the end, 155.5 million votes were cast in the presidential race last year, down from 158.6 million in 2020 but still the second-highest total in U.S. history.
To be fair, we should also account for population growth, though the population grew more slowly between 2020 and 2024 than in most elections. (Among other reasons: high excess deaths because of COVID.) So, using data from US Elections Project, I’ve calculated the share of the vote each party received since 19721 as a proportion of the voting-eligible population (VEP), along with the share of eligible voters who didn’t participate. (To be part of the VEP, you have to be 18 years old, a U.S. citizen, and in most states, not disenfranchised by a felony conviction.)
Almost always, the number of eligible non-voters exceeds the total number of votes for either major party — although Joe Biden essentially tied the non-voter number in 2020 with his record 81.2 million votes. Harris’s 75 million votes reflected a decline from Biden’s. Still, she received votes from 30.7 percent of the VEP in 2024, the third-highest total for a Democrat since 1972, exceeded only by Biden in 2020 and Barack Obama in 2008. Harris’s VEP share would also be large enough to win the popular vote in any of the 1976, 1980, 1988 and 2004 elections against Republicans, all of which Democrats actually lost. Based on her VEP, she’d almost certainly also have won by a wide enough national margin to have taken the Electoral College in 2000 and 2016 (which Democrats lost in those years despite winning the popular vote).
This isn’t proof of anything in itself: we need more detailed analyses for that. But there’s been a secular increase in turnout in recent elections, a silver lining that even people who are worried about the future of American democracy (and I count myself among them) can appreciate.
The nitty-gritty of the 2024 vote
The most important findings for analyzing the effects of turnout are buried deep within the Catalist report, which focuses primarily on demographic shifts.2 The findings aren’t super intuitive unless you parse the numbers carefully, so let’s take the time to work through them. First, here are their estimates of the amount of churn in the electorate:

As a newsletter writer, I know a lot about churn. Your overall number of subscribers might appear relatively consistent from day to day. But actually, a lot is going on under the surface. Some people cancel or their subscriptions lapse due to their credit cards failing. You hope they are outnumbered by the number of new subscribers. Often, it roughly evens out.
Voting in presidential elections is similar. Catalist estimates that 126 million people voted for president3 in both 2020 and 2024; these are what they call “repeat voters.” But 30 million voters dropped out of the electorate. A substantial minority of this has an unhappy cause: former voters dying. But the majority is due to people choosing not to vote.
However, these “dropoff voters” are usually replaced by an equal or greater number of new voters. About 4 million Americans turn 18 each year, or about 16 million over a four-year cycle. Then other people are inspired to participate in elections when they might not have been before. But 2024 was an exception to this: there were fewer new voters (26 million) than dropoff voters (30 million).
Some of that is because it was coming against a record-setting turnout baseline in a pandemic year. COVID-19 both motivated states to provide new means of voting and made the stakes of the election feel existential; frankly, it probably increased certain types of political participation due to boredom, frustration, and anxiety about the state of the country.
Still, did the drop off in participation hurt Democrats? Yes, but that wasn’t necessarily the primary source of Harris’s problems. This chart in the Catalist report gives us some more clues:
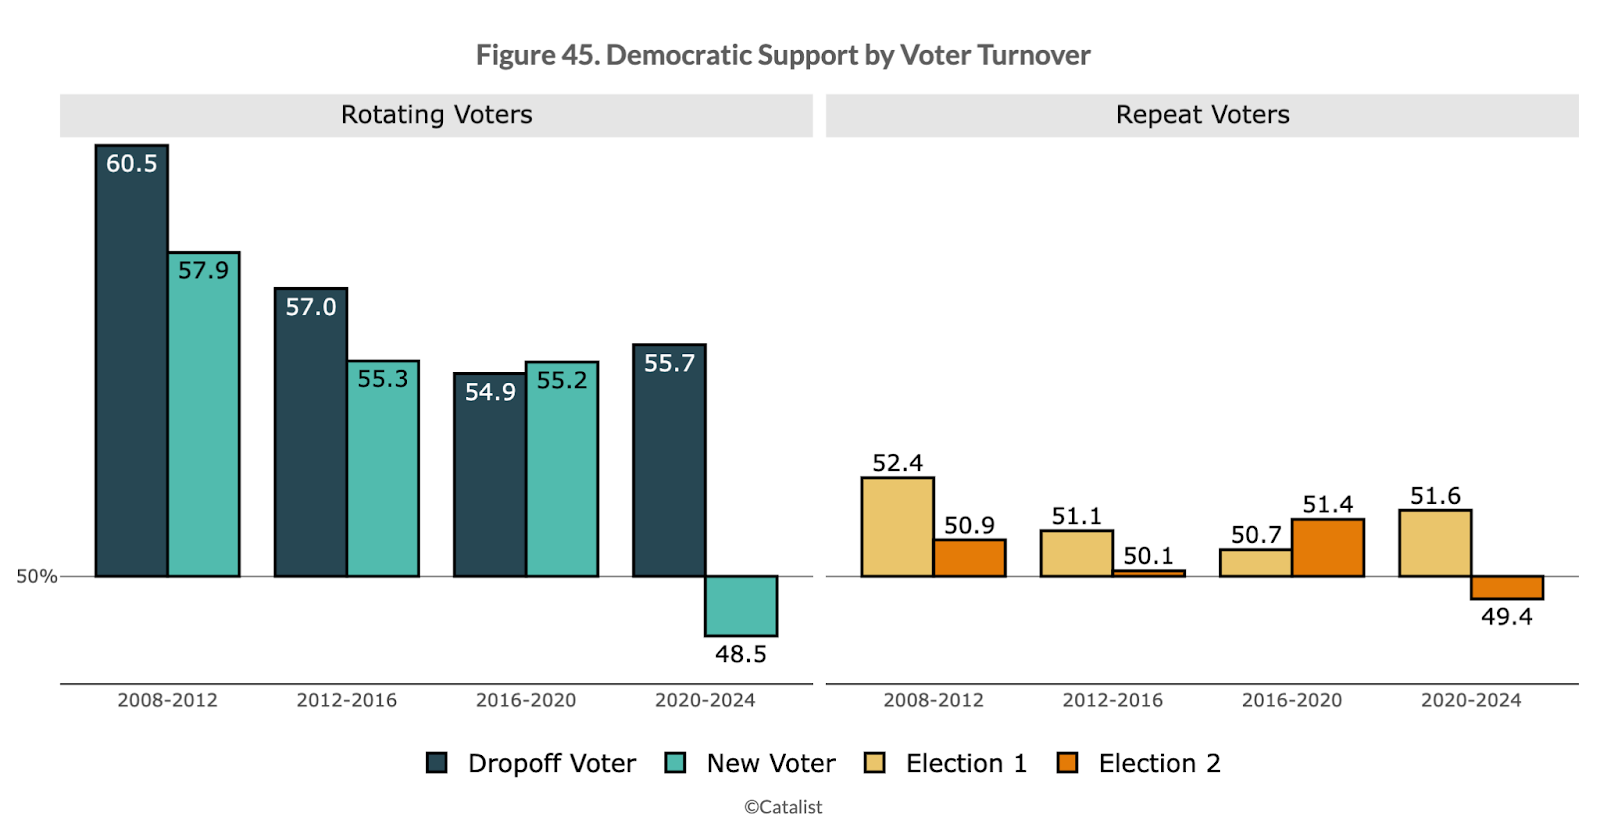
About 56 percent of dropoff voters — people who voted in 2020 but not in 2024 — had voted for Biden in 2020, excluding third-party voters. (All of Catalist’s figures reflect the so-called two-way vote: the share of the major-party vote received by Democrats rather than Republicans.) That hurt Harris, certainly. But two other shifts also harmed Democrats. First, unusually, a majority of new voters (people who didn’t vote in 2020) voted for Trump. Since many new voters are young voters, this reflected a substantial tepidness toward Democrats among the younger ranks of Gen Z. However, as the Catalist report suggests, it was mostly relatively moderate young voters, particularly young Black and Hispanic men, who drove the shift rather than the campus activist types the media more often writes about:

What’s more, Harris also (slightly) lost to Trump among repeat voters, a majority of whom had voted for Biden in 2020. This potentially has a greater impact due to the arithmetic. When a voter switches parties, it essentially counts as a negative 2: you go from a +1 in your margin against the other party to a -1. When a voter chooses not to participate, it has half the impact, a negative 1.4
So, which was more important overall: voter switching or churn?
In the chart below, I’ve constructed a balance sheet for how the vote changed between 2020 and 2024: why Harris received 6.3 million fewer votes than Biden, while Trump got roughly 3 million more than he did in 2020. This is one of those times when it’s probably easier to show you the chart first and then talk through the data:
Let’s work through the chart one line at a time:
The first two lines show Biden to Trump and Trump to Harris “switchers” among people who voted in both elections. Catalist’s data says among the 126 million people who voted for major parties in both elections, Democrats went from winning by 3.2 percentage points to losing by 1.2, a net swing of 4.4 points. Multiply 126 million voters by a 4.4-point swing, and that works out to a net shift of 5.5 million votes against Democrats, erasing most but not all of Biden’s 7.1 million vote margin in 2020.
However, this 5.5 million is a net number: Biden/Trump switchers hurt Democrats, but Trump/Harris switchers helped them. In other words, the changes didn’t entirely go one way: Harris did pick up some people who voted for Trump in 2020. How many? It’s not apparent in the Catalist report, so let’s turn to some other sources. According to the national exit poll, 5 percent of Biden 2020 voters who participated in both elections voted for Trump in 2024, while 4 percent of Trump 2020 voters went for Harris instead. The final New York Times/Siena College poll shows more lopsided figures, conversely, also with 5 percent of Biden voters switching to Trump, but only 2 percent of Trump 2020 voters picking Harris. Although the exit poll has a much larger sample size, I generally consider the NYT/Siena data more reliable, so it probably makes sense to take a rough average of these two.5
In truth, both of these polls are probably underestimating the number of people who switched parties because people often misstate or misremember who they voted for, claiming their voting preferences have been consistent when they actually weren’t. Still, I assume from these polls that there were approximately twice as many Biden/Trump switchers as Trump/Harris switchers. If you work out the algebra, it implies that Democrats lost a net of 11 million votes from Biden/Trump switchers, but regained 5.5 million from Trump/Harris switchers, matching the net loss of 5.5 million votes from repeat voters in Catalist’s figures.
Catalist’s report basically ignores the impact of third parties, but this likely hurt Democrats, too. Both the exit poll and NYT/Siena suggest that 2 percent of Biden's 2020 voters chose third parties instead in 2024, while approximately 1 percent of Trump's 2020 voters did — but those figures ignore voters who dropped out of the electorate, as about 20 percent of 2020 voters did. This works out to about 1.3 million Biden 2020 voters choosing third parties in 20246 and 0.6 million Trump voters doing so. Unlike with the previous categories we’ve talked about, a lot of this probably was voters on the left, upset over U.S. policy toward Israel or other things. Jill Stein, RFK Jr., Cornel West and various minor socialist parties combined for around 2 million votes.
Some people who voted for third parties in 2020 shifted to one of the major candidates in 2024, conversely. The exit poll says 44 percent of 2020 third-party voters selected Trump, 34 percent chose Harris, and 22 percent voted for third parties again. But I assume that, among this group, dropoff rates were extremely high because they were already so dissatisfied with the major-party options that they cast a protest vote in 2020. So take the 3.1 million third-party voters from 2020, divide them by two to reflect dropoff, and assign 44 percent of them to Trump and 34 percent to Harris. That equates to Trump picking up 0.7 million votes from people who chose an independent candidate in 2020, and Harris 0.5 million.
Next are voters who dropped out of the electorate entirely. Catalist estimates that there were 30 million of these, and 55.7 percent of them had voted for Biden. But it appears their data counts voters who chose third parties in 2024 as having dropped out, whereas I accounted for them separately in the previous steps. So, I backed out the third-party voters from their estimates to avoid double-counting. This produces a remainder of 15.4 million 2020 Biden voters leaving the electorate, and 12.7 million Trump 2020 voters.
Then there are new voters; Catalist says there were 26 million of them, and 51.5 percent voted for Trump. This is pretty straightforward: that works out to 13.4 million new Trump voters, and 12.6 million new Democratic voters.
Finally, I double-checked that the balance sheet math works: that after these various additions and subtractions, we’ve matched the hard data on the number of votes Trump and Harris received overall in 2024. Fortunately, we got quite close. But there were about 100,000 too few Harris voters and half a million too many Trump voters due to rounding and other inexact assumptions. I’m just marking these as “correction for rounding” rather than doing anything fancier.
OK, so that was a lot of work. So let’s roll these up into three large categories:
Democrats lost a net of 6.4 million votes from repeat voters switching, mostly to Trump (5.5 million) but some to third parties (0.9 million).
Then they lost a net of 2.7 million votes due to dropoff voters.7
Further, they lost a net of 0.8 million votes because more new voters went for Trump.
So while Democrats lost ground pretty much every way you can on the balance sheet, the impact of repeat voters switching was about twice as large as from dropoff voters exiting the electorate.
But there’s another wrinkle. As you can see from the Catalist data, it’s actually common for most dropoff voters to be Democrats: this also happened to the party in 2012, 2016 and 2020. In some sense, that’s a sign of being a victim of your own success. If you’re good at turning out marginal voters, you’re happy to book the win — but they might not vote again next time.
In past elections, however, new voters were also Democratic, enough to more or less cancel this out. This time, however, the majority of new voters picked Trump.
Put another way, Democrats performed poorly among marginal voters in general: people who don’t read the news that much, and whose political views don’t match the ideologically “consistent” views of strong partisans. Young voters, voters of color, and voters without college degrees are overrepresented in this cohort, all groups that Democrats struggled with in 2024 compared to previous elections.
There’s no bright line between turnout and persuasion
There are a lot of ways you can squint at this data. Harris lost the election by 2.3 million votes, and per our calculations above, she lost a net of 2.7 million votes from dropoff voters. So even if there had been some vote switching and Trump had gained from new voters, she would have won the popular vote by around 400,000 voters without those dropoffs; the Electoral College would have been very close.
This ignores a major complication, however. Those Democratic dropoff voters weren’t necessarily Harris’s to keep. If you’d forced them to vote8, a lot of them might have chosen Trump or a third party instead.
Not voting is a choice, in other words. Almost by definition, it’s a choice that voters are more likely to make when they’re indifferent between the major-party options or don’t see either of them as offering a sufficiently persuasive alternative.
I’ll even cite myself here as an example. After the debate, when it looked like Democrats were still going to nominate Biden, I planned to vote third-party9 or just skip the presidential ballot line unless he was replaced on the ballot. I’ve never found Trump to be an acceptable choice, particularly not after January 6. But the idea of Biden still being in office for four more years through age 86 was also dangerous and unacceptable, I thought. (We’ve been over this, but subsequent reporting has found that Biden’s condition was even worse than I feared.)
Other voters might have different reasons for this pox-on-both-houses mentality. Maybe they hate Republican policy on abortion, but think Democrats ruined the economy. Or they thought Democrats lost the plot on immigration, but feared Trump’s corruption and the influence of Elon Musk. You can knock on such a voter’s door or send her another flyer, but she’s not receptive to your message, it might just annoy her.
Indeed, this is reflected in the way campaigns prioritize their voter contacts. This Catalist chart shows the 2x2 matrix campaigns use to model the electorate: basically, every voter gets one score from 0 to 100 indicating how likely they are to vote, and then another 0-to-100 score for how likely they are to vote Democratic, conditional upon voting:
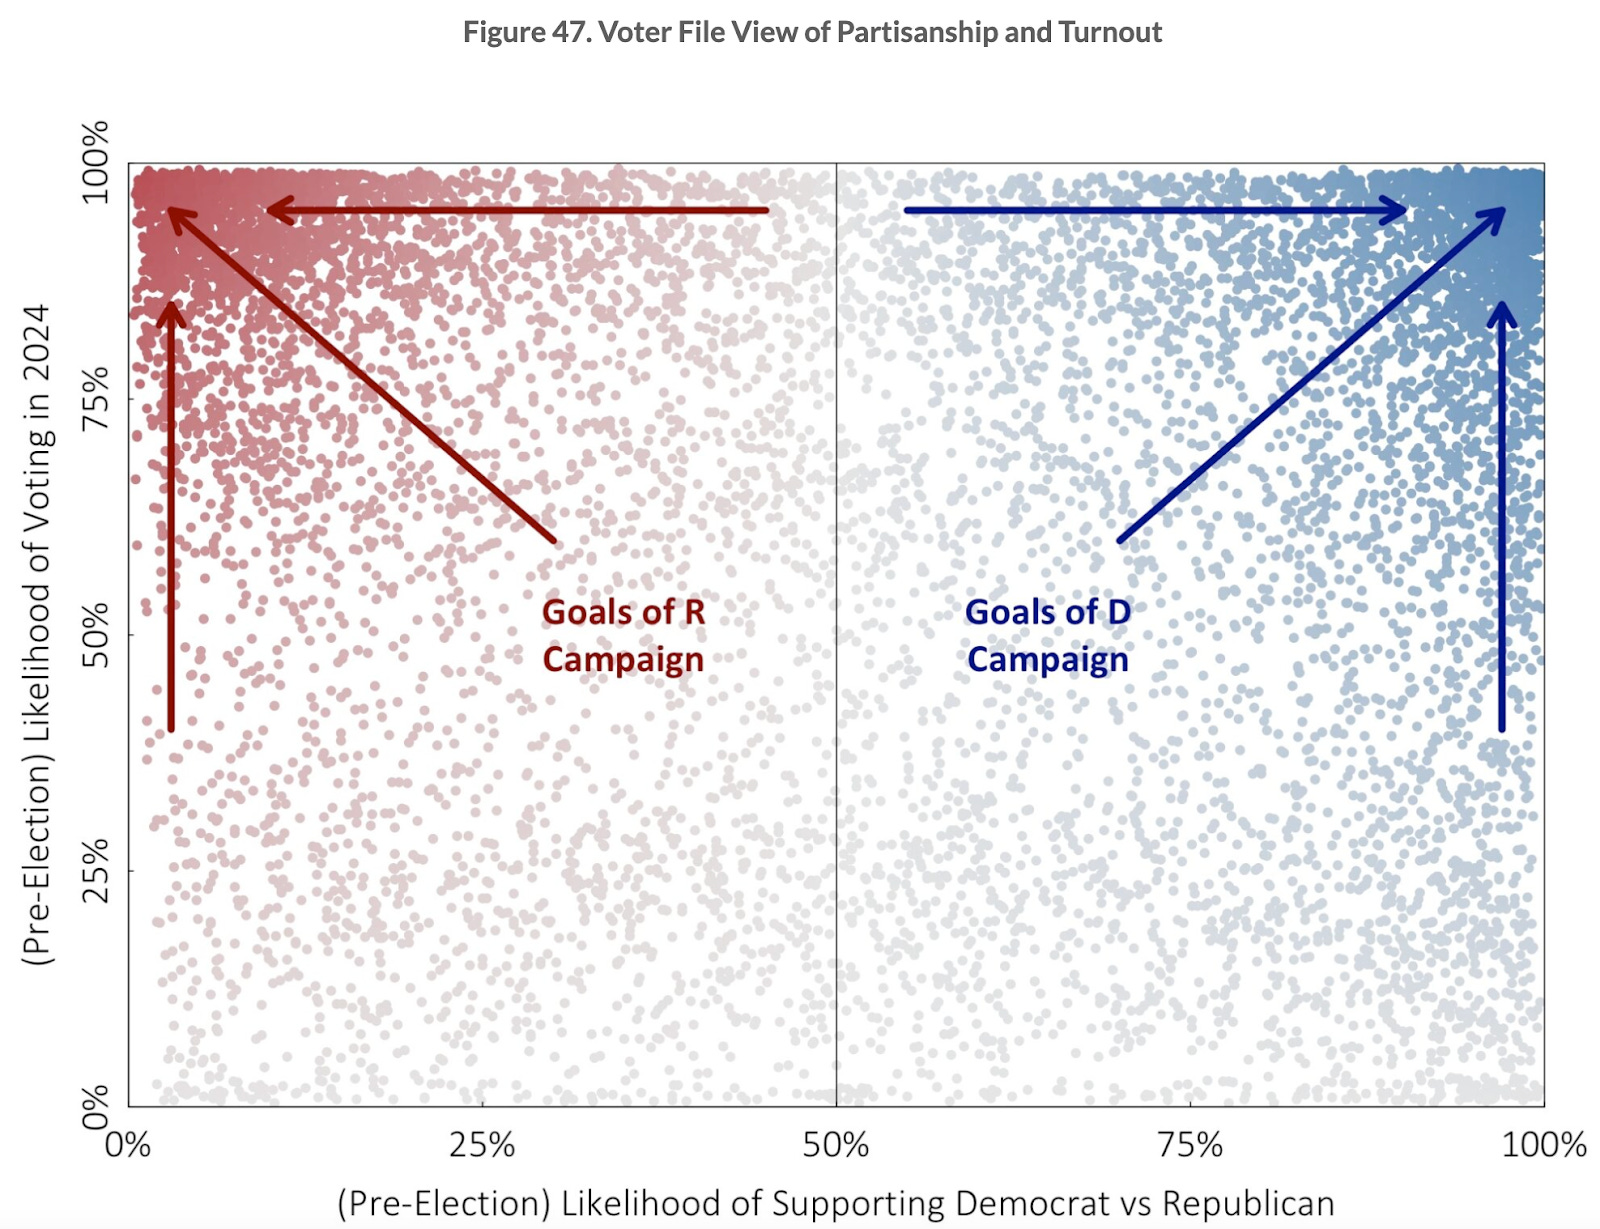
Voters are by no means distributed evenly throughout this space. Instead, strong partisans on either side are also much more likely to vote. It can actually be a little dangerous to contact a voter when you have low confidence about their partisanship. Pick whatever stereotype you want: a Democrat from Brooklyn with some obvious liberal signifiers parachutes into the working-class suburbs of Pittsburgh for the weekend to get out the Harris vote. Although the volunteer is conscientious, all that winds up happening is the voter is reminded that the election is coming up, so they end up turning out and voting for Trump when they otherwise might have sat out.
So, if Democrats don’t have a persuasive message to marginal voters, they can’t really solve that problem with higher turnout. In fact, they may often be rooting against it.
I’m not actually that pessimistic about Democrats’ chances in 2028, in part because I don’t think campaigns matter that much at all compared to policy choices and underlying conditions. But to the extent they do, Democrats need some new strategies. And they need new talent whose values and vibes are a better match for the marginal, often relatively apolitical voters who frequently decide elections.
The first election since the Twenty-Sixth Amendment was passed, giving 18-year-olds the right to vote, which lowered turnout because young people are less likely to participate in elections than older ones.
There may or may not be a separate newsletter coming on those.
It’s a little bit ambiguous from their write-up, but it appears that Catalist estimates include voters for the major-party candidates only among their repeat voters; we’ll talk about third-party voters separately.
There’s perhaps some analogy here to the importance of the 3-point shot in the NBA: you can crunch all the numbers you want, but fundamentally it matters a lot that three points are worth more than two.
Also, note that there were more Biden voters than Trump voters in 2020. So, there was not only a higher percentage of switchers, but they were coming out of a larger pie.
That is, 2 percent of 80 percent of 81.3 million.
As I define “dropoff”, meaning not voting at all, whereas Catalist treats third-party voters as dropoff voters too.
Well, except for the ones who died or became ineligible to vote.
I’d have had to write someone in because there weren’t any independent candidates listed on the New York ballot.
The messaging of both the 24 Biden/Harris and the 24 Harris/Waltz campaign was an incoherent disaster. I an extremely engaged Democratic partisan, and even I barely heard a clearly articulated message other than "Vote for us because we aren't Donald Trump." Harris backtracked her Medicare for All vow from the 2020 primary without really laying out any new plan. There was some kind of concept of a plan about inflation price increase caps without much detail on how it would be implemented.
As a swing state voter, I was always going to (and did) vote for the Dem nominee in 2024, but running as a status quo candidate at a time when most people hated the status quo was always going to fail. And yes, if you look at the stock market instability and blatant corruption and gangs of unaccountable masked ICE agents disappearing people from the country without a trial, then obviously the status quo would have been better than this, but it was never a winning message.
Tangential to this subject matter, but pertinent to the 2026 and 2028 campaigns …. Just finished Original Sin, the book about the Biden “cover up.” Not much new info for people who were already following that disaster, but the most striking thing about the book is how essentially all of the Dem senators/reps/cabinet members that speak to the authors are anonymous. In other words, they are now open to criticizing Biden - “I couldn’t believe how bad he looked” - but they are STILL unwilling to do so on the record. Wtf?
Keep on stonewalling, Dems. Refuse to acknowledge your mistakes. Refuse to reflect and correct. See how far that gets you.